1Getting started
HarborLink Network is the record of HarborLink's fiber network: the route segments, manholes, sites and routes from Tom's KMZ files, and the ducts, cables, fibers, splices and customers recorded on top of them. It replaces the Esri / ArcGIS maps and Field Maps. It runs in a web browser on a computer, tablet or phone; there is nothing to install.
This guide goes task by task. Each “How do I…” has short numbered steps. Words in bold are buttons or labels exactly as you see them on screen. Every term is explained the first time it appears, and again in the glossary.
The screenshots come from the demo dataset, which adds made-up cables, customers, splices and photos to the real network so there is something to show. Names that start with Sample are not real customers.
Who does what
What you can do depends on your role, which an admin gives you:
| Role | Can |
|---|---|
| Viewer | See everything on the map, including ducts, cables, fiber tables, splice cases, panels and circuits. Trace fibers. Open and print breakout diagrams. Copy selections. Check an address's distance to the network, use the Sales page, and see the HarborCRM deals fibers and circuits are linked to. |
| Editor | Everything a viewer can, plus edit mode: change details, draw and reshape segments, add and move structures, retire features, record construction progress, take photos and add as-builts, record ducts, cables, fiber assignments, splices, panels, ports and circuits, link fibers and circuits to HarborCRM deals, and load them from spreadsheets on the Fiber data page. |
| Admin | Everything an editor can, plus the Admin page: users and roles, KMZ imports, how % complete is weighted, share links, system status and the audit log. |
Where to start, depending on your job:
How do I sign in?
- Open the app's address in your browser. You see the Sign in to the network map card.
- Type your Email and Password, then press Sign in.
- The map opens. You stay signed in on that browser until you sign out, or until you have not used it for a while.
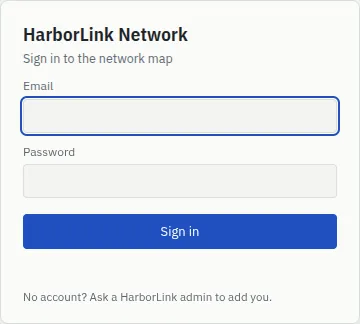
If the email or password is wrong you see Email or password is incorrect. Check for typing mistakes and try again. You see the same message if your account has been deactivated: then ask an admin to activate it.
How do I choose my password the first time?
An admin gives you a temporary password when they add you. The first time you sign in with it:
- Sign in with your email and the temporary password.
- The Choose a password card appears. Type your new password in New password and again in New password again.
- Press Save and continue. The map opens.
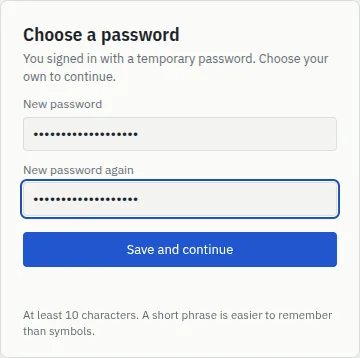
There is no “change my password” page yet. If you forget your password, or want a new one, ask an admin to reset it; you then choose a new one at your next sign-in.
How do I sign out?
- On the map, look at the bottom of the left-hand column (on a phone, scroll to the very bottom of the page).
- Press Sign out.

The screen at a glance
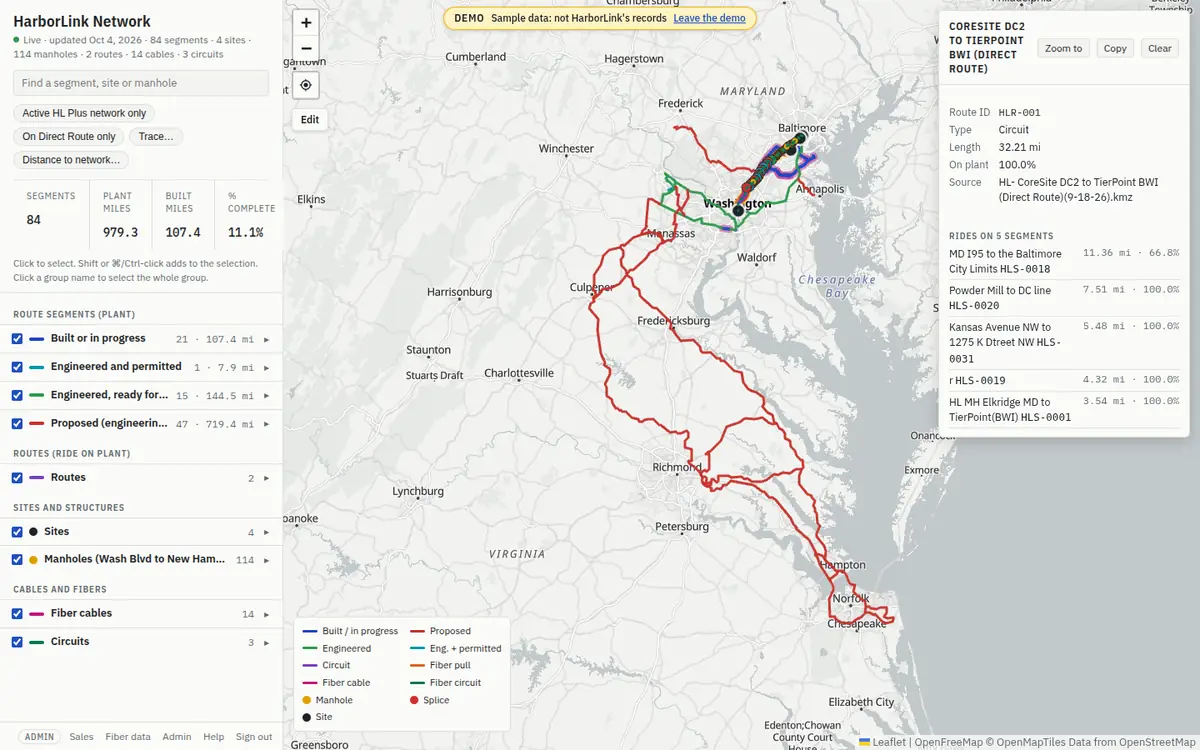
- The left column holds the header (how many segments, sites, manholes, routes, cables and circuits there are, and when the data last changed), the search box and filters, Trace… and Distance to network…, the totals strip and the layer register, the list of everything on the map.
- The map in the middle. Drag to move, scroll or pinch to zoom, or use + and −. Hover over a line or dot to see its name and length.
- The selection panel on the right shows whatever you have selected. See Reading the selection panel.
- The legend at the bottom left says what the colours mean. See Status colours.
Light and dark
The app follows your device's setting: if your computer or phone is in dark mode, so is the map. There is no switch in the app; change it in your device's display settings. Printed pages and PDFs always use the light colours.
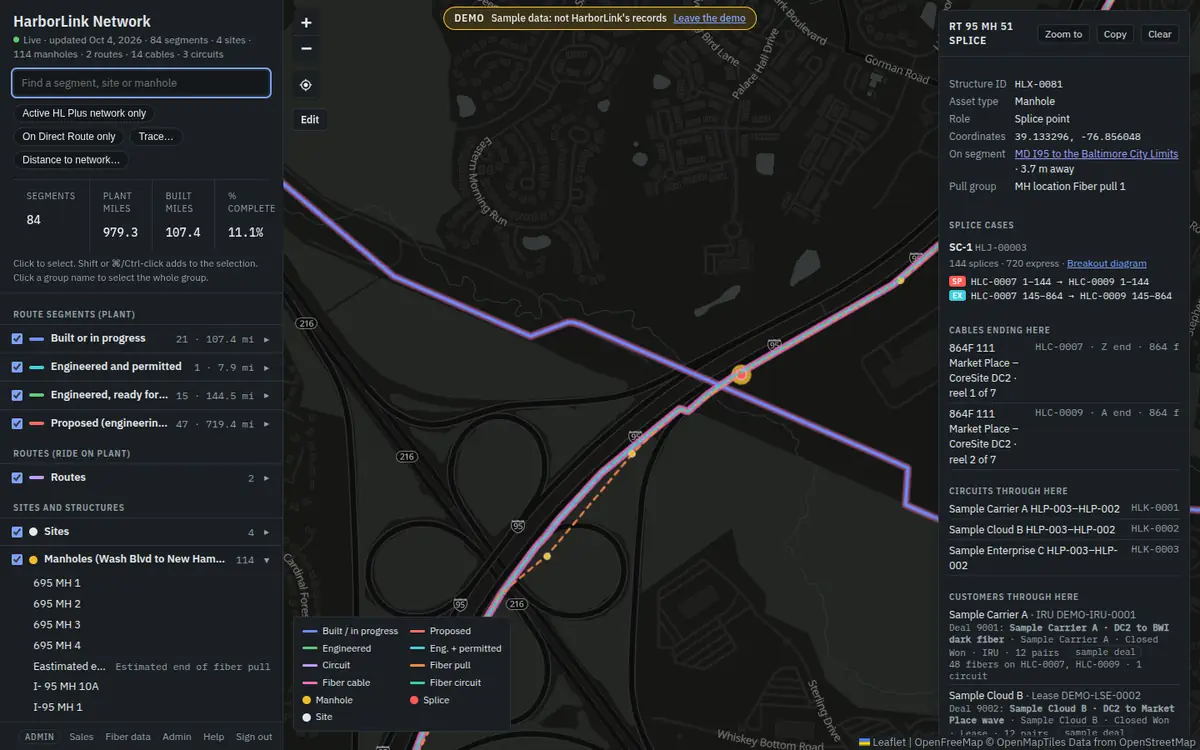
On a phone or tablet
On a narrow screen the map fills the top of the page, the selection panel sits over the bottom of the map, and the left column (search, filters, totals, register and the sign-out link) moves below the map: scroll down to reach it. The legend is hidden to save room. While editing, the map grows taller. See In the field.
Coordinates
The box at the bottom left of the map shows the latitude and longitude under the pointer. On a phone, a small cross marks the middle of the part of the map you can see, and the box shows where it is, or where you last tapped. Click or tap the box to copy them; where the browser cannot copy, it selects them for you to copy.
If the map is a Google map
Your admin decides which map the app draws on: the street map it has always had, or Google Maps. With Google Maps, Google's logo is on the map and the foot of the page says This app uses Google Maps features and content, with links to Google's terms and privacy policy. Everything else in this guide works the same on both; this part is about what Google adds.
Map types and Google's layers
- Press Map at the top left of the map to choose Roadmap, Satellite, Hybrid (satellite with street names, the first choice) or Terrain. Your browser remembers the choice.
- Below them, turn on Google's Traffic, Transit, Bicycling or Street View coverage (blue lines where Street View is).
- Satellite and Hybrid zoom in as far as Google has imagery.
Tilting and turning the map
- Use the camera control (top left; on a phone, top right), or hold Shift and drag. On a phone, drag up or down with two fingers to tilt, and twist them to turn.
- Everything works on a tilted map. While you draw or reshape a segment, or draw an area for Select area, the map stays still: drawing puts it flat and north up first, and tilts it back when you are done.
Street View
- Select one thing and press Street View in the selection panel. Street View opens at the nearest street within 50 m (164 ft), facing it; for a segment, near its middle. If there is none that close, a note says so.
- Or drag the little person (Pegman) from the map's corner onto a street.
- Press Back to map, or Street View's own close button, to return. Your selection is kept.
- Street View opens only when you ask: each view is billed to HarborLink.
The 3D view
- Press 3D on the map for Google's photorealistic 3D view of the same place, with the network drawn on the ground. Drag to look around; scroll or pinch to move closer.
- Click a segment, site or manhole to select it, as on the map; click open ground to clear the selection. Nothing can be edited in 3D.
- Press Back to map or 2D, or Esc, to go back to the map where the 3D view was looking. Edit, Select area, My location and the other map buttons go back to the map first.
- The 3D view needs graphics acceleration; without it, the app says so. It loads only when you ask (it is billed to HarborLink, once each time the page is opened), and you cannot open it while placing a structure or drawing a line.
Status colours and what they mean
Route segments are coloured by their lifecycle status: where the segment is in its life, from proposed to built. The colours are the ones in Tom's KMZ legend.
| Colour | Group in the register | Legend | Lifecycle statuses in it |
|---|---|---|---|
| Blue | Built or in progress | Built / in progress | Under Construction, Construction Complete, Maintenance |
| Light blue | Engineered and permitted | Eng. + permitted | Approved |
| Green | Engineered, ready for permit | Engineered | Design |
| Red | Proposed (engineering study complete) | Proposed | Proposed (engineering study complete) |
| Grey | Unclassified | — | Warehouse, Abandoned, Removed, or none. (None on the map today.) |
Why red says “Proposed (engineering study complete)”. Tom's KMZ legend says red means “Right-of-Way acquired and engineering study completed”. No right-of-way agreement is on file for those routes (about 719 miles), so the app does not claim right-of-way: it labels them Proposed (engineering study complete) until HarborLink confirms. Esri's list of lifecycle stages has nothing before Design, so this one stage was added. The KMZ's own wording stays on each segment as its KMZ colour.
Blue is split in two. Blue segments in the Active HL Plus network are recorded as Construction Complete and In Service; other blue segments as Under Construction. Editors can correct either.
Asset state is a second, separate status: whether the plant is in use. It is one of Proposed, In Service, Out of Service or Planned Removal. A small repair does not change the lifecycle status, and construction progress never changes either: only people do.
Other things on the map:
| Looks like | Is |
|---|---|
| Purple dashes | A route of type Circuit, e.g. the Direct Route from CoreSite DC2 to TierPoint BWI. Routes come from the KMZ and ride on the segments. |
| Orange dashes | A route of type Fiber pull. |
| Pink band | A fiber cable, drawn as a wide pale band under the segments it runs through. |
| Green dots | A fiber circuit: a customer's service between two ports, drawn along the cables it runs on. |
| Yellow dot | A manhole (other structures such as handholes and vaults are yellow too, and a little larger). |
| Red dot | A splice point, or the end of a fiber pull, as marked in the KMZ. |
| Light-blue dot | A reel set-up point. Green dot: an estimated end of a fiber pull. (These two are not in the legend.) |
| Black dot with a white ring | A site: a data center or other building. |
| Yellow glow | What is selected. |
| Bright cyan, with rings | A trace: the path of the fibers you traced, with a ring at each manhole or site it passes. |
2Finding things on the map
The layer register
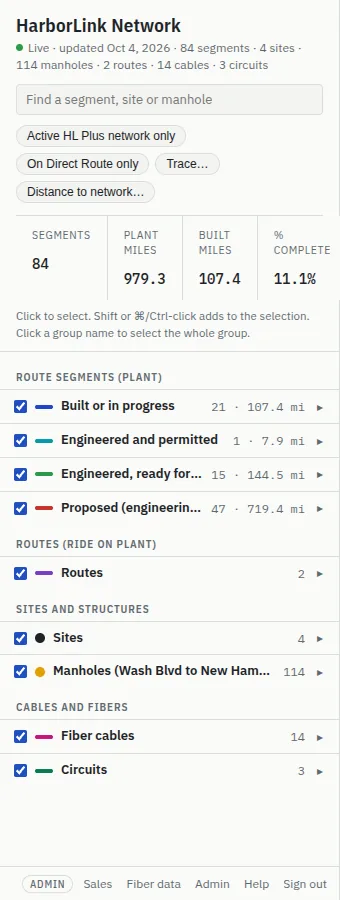
The layer register is the list in the left column. It holds everything on the map, in groups:
- Route segments (plant): one group per status colour. A route segment is a stretch of HarborLink's conduit or other plant, with a code like
HLS-0018. - Routes (ride on plant): the KMZ's routes (codes like
HLR-001). - Sites and structures: sites (
HLP-…) and manholes and other structures (HLX-…). - Cables and fibers: fiber cables (
HLC-…) and circuits (HLK-…), once any are recorded.
How do I show or hide a group?
- Untick the box beside the group's name to hide it from the map; tick it to show it again. Hidden groups also leave the totals.
How do I see what is in a group?
- Press the arrow ▸ at the right of the group. The list opens, sorted by name (numbers in natural order: 2 before 10).
- Click an item to select it; the map zooms to it.
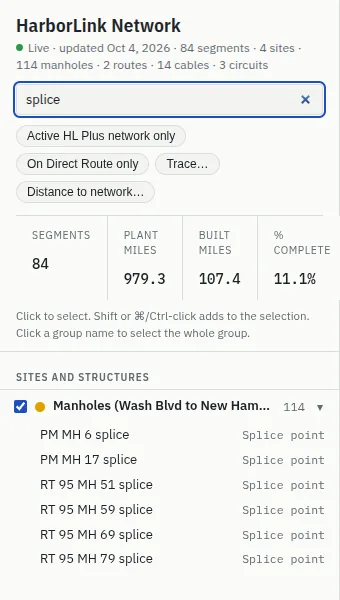
How do I find something by name or code?
- Type in Find a segment, site or manhole at the top of the left column: part of a name (Market) or a code (HLX-0081, HLC-0007, HLK-0001).
- The register shrinks to the matching items, with their groups opened.
- Click one to select it and zoom to it.
- Clear the box to see everything again.
How do I show only the Active network or the Direct Route?
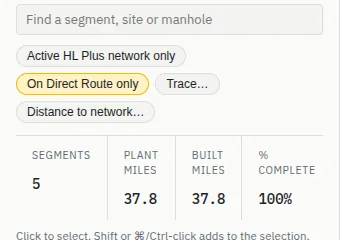
- Press Active HL Plus network only to show only the segments in the Active HL Plus network (the segments in Tom's Active HL Plus Partner Network KMZ).
- Or press On Direct Route only to show only the segments the Direct Route rides on.
- A pressed filter turns yellow. Press it again to turn it off. You can use both at once.
Filters only hide segments; sites, manholes, routes, cables and circuits stay. The totals follow the filters.
The totals strip and % complete
The four figures under the filters count the segments shown on the map right now: groups that are ticked, and segments that pass the filters.
- Segments: how many.
- Plant miles: their total length.
- Built miles: the length of those that are built or in progress (blue).
- % complete: construction progress over those segments, weighted by length. It comes from the footage crews record (see Construction progress) and the weights an admin sets (see % complete weights).
For example, to see % complete for built plant only, press Active HL Plus network only, or untick every segment group except Built or in progress.
How do I select things?
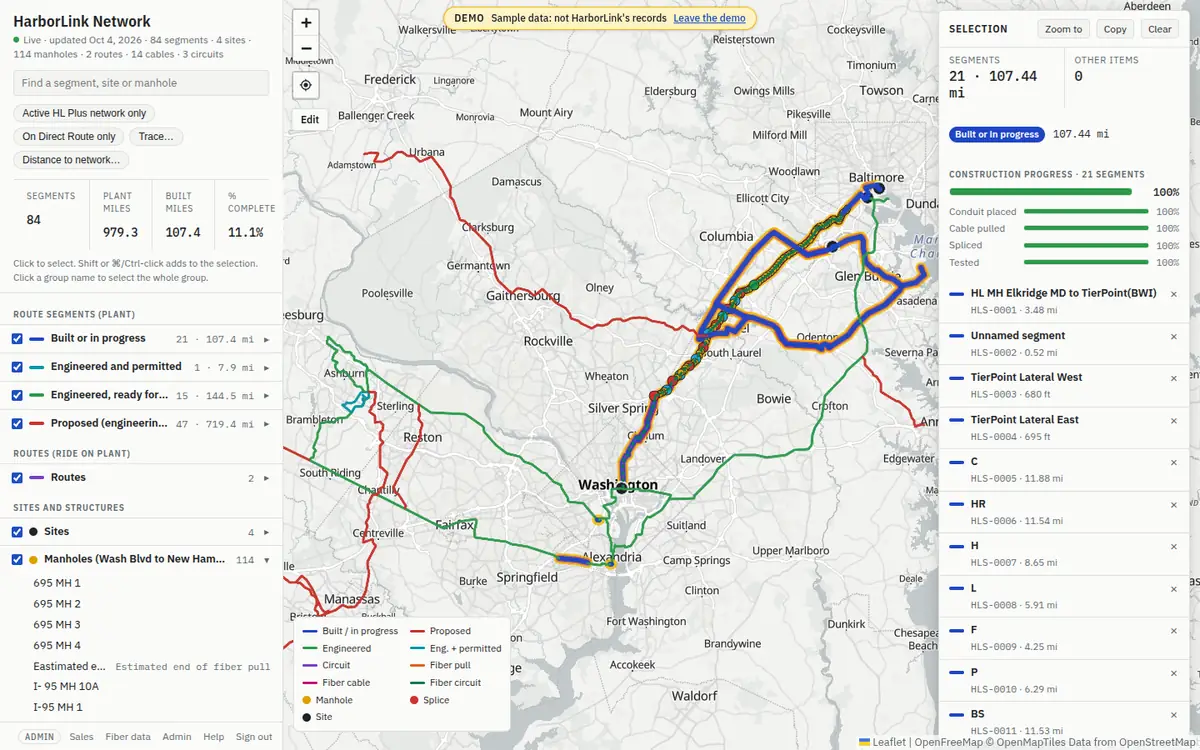
- One thing: click it on the map, or in the register. Its details appear in the selection panel, and it glows yellow.
- Add or remove one: hold Shift, or Ctrl (⌘ on a Mac), and click.
- A whole group: click the group's name in the register. Click it again to unselect. Shift-click a group's name to add it to what is already selected.
- Everything in an area: press Select area on the map and draw a box or a lasso. See How do I select an area?
- Nothing: click an empty part of the map, or press Clear in the panel.
- Zoom to the selection: press Zoom to in the panel.
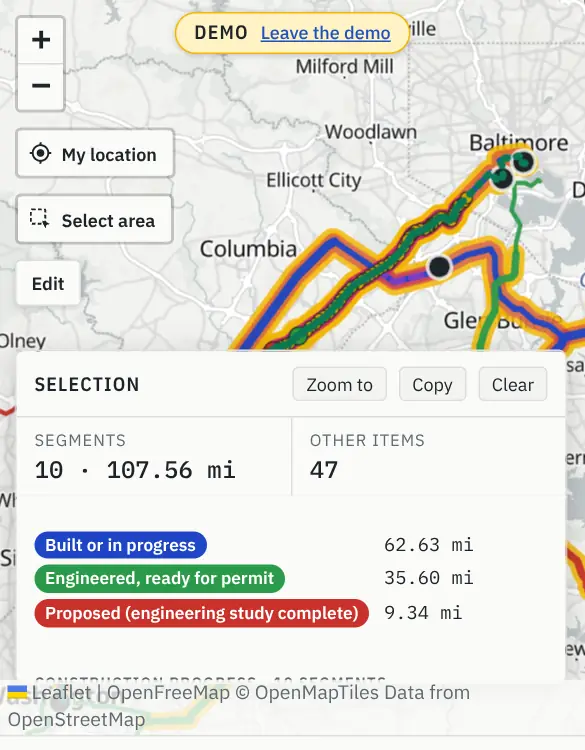
With several things selected, the panel shows how many segments and miles, the miles in each status, the combined construction progress, and a list. Press × beside an item to take it out.
Cables are drawn under the segments, so clicking a line usually selects the segment. To select a cable, pick it in the register's Fiber cables group, search for its HLC- code, or untick the segment groups and click the pink band.
How do I select an area?
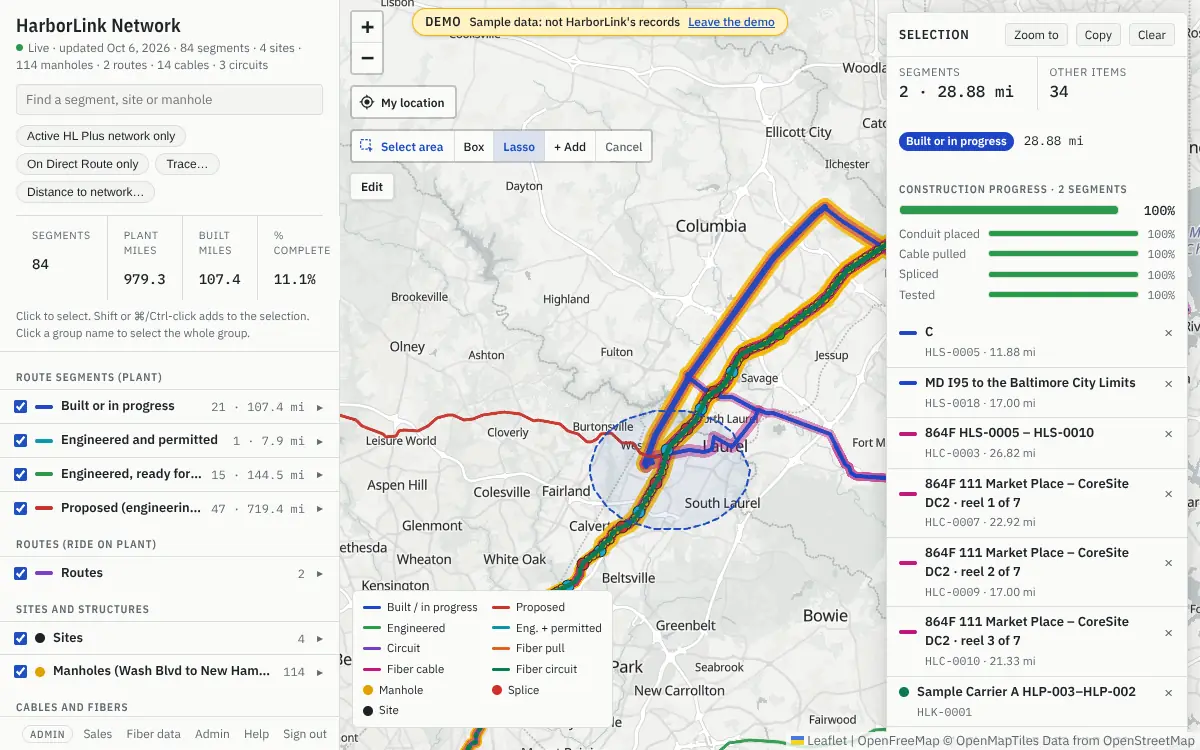
Select area, under My location on the map, selects everything shown inside a box or a loop you draw: on a computer with the mouse, on a phone with one finger.
- Press Select area. Box, Lasso, + Add and Cancel appear beside it.
- Pick Box to drag a rectangle, or Lasso to draw round what you want; the lasso closes itself when you let go. The shape shows as you draw.
- Let go. Everything shown on the map that the shape touches is selected, and the selection panel lists it, with its miles and progress, ready to copy.
- What counts: anything that is inside the shape or crosses its edge: a segment, cable, circuit or route only partly inside is selected whole. Groups you have unticked in the register, and segments the filters hide, are never selected. To leave out routes, cables or manholes, untick their groups first.
- Replace or add: a new area replaces the selection. To add to it, hold Shift while you draw, or, on a phone, press + Add before drawing.
- One area at a time: after one area the tool puts itself away, so the map pans again. Press Select area again for another.
- Changed your mind: press Esc or Cancel, even halfway through drawing. Nothing is selected.
- While the tool is out, a drag draws instead of moving the map. You can still zoom with the buttons, the mouse wheel or two fingers, and tap one thing to select it.
How do I copy a selection into a spreadsheet?
- Select what you want (for example a whole group).
- Press Copy in the panel. The button says Copied.
- Paste into Excel or Google Sheets. Each item is a row, with the columns ID, Name, Type, Status, Miles, Lat, Lon, Owner and Complete (% complete, for segments).
This is TSV: text with a tab between columns, which spreadsheets paste straight into cells. If your browser blocks it, the button says Copy blocked.
How do I see what changed or was reported between two dates?
Every date filter works the same way. Choose Today, Last 7 days, Last 30 days, This month, or Custom… and pick the first and last day. Days are whole days in your own time zone, and both ends count. You can choose up to a year.
On the map: what changed.
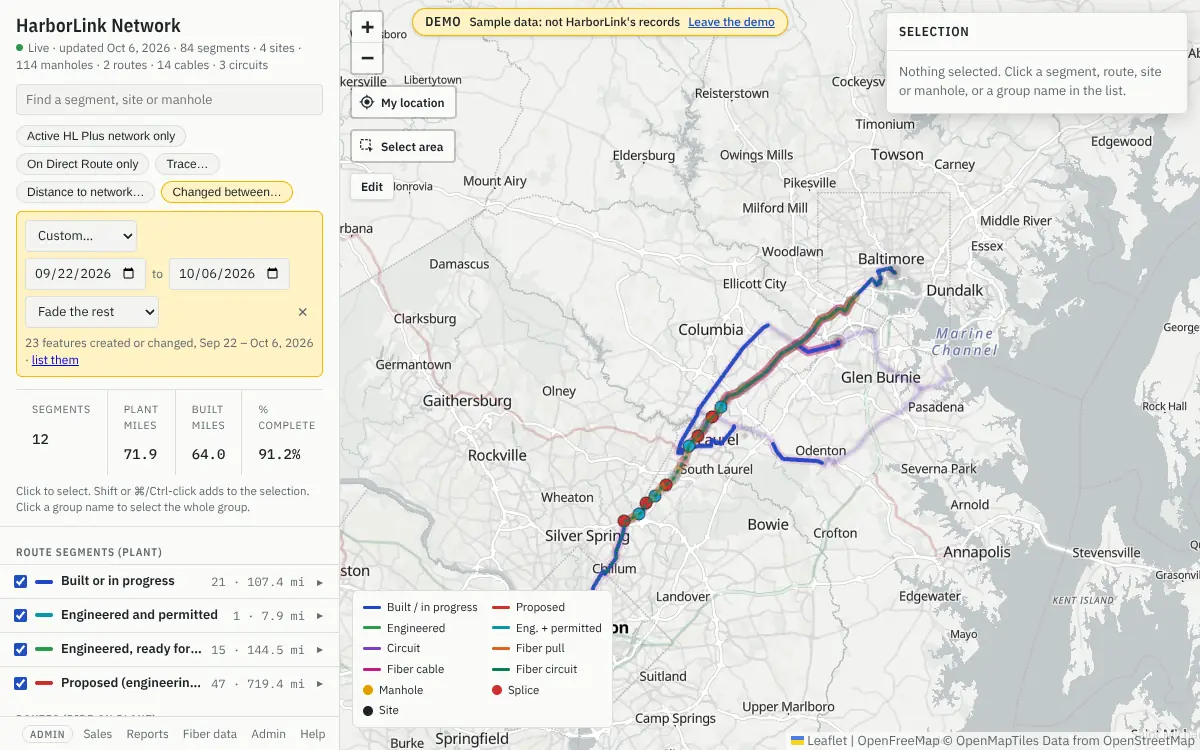
- Press Changed between… under the search box. It starts at the last 7 days; change the dates in the yellow box.
- The map now shows only what was created or changed in those days: edits, new features, retirements, progress, photos, ducts (on their segment), splice cases and panels (on their manhole or site), fiber changes (on their cable), and KMZ imports. The totals strip and the register follow, and you can select only what is shown.
- Choose Fade the rest to keep the rest of the network on the map, faint, for context.
- list them opens the same days on the Reports page. Press × or the chip again to turn the filter off.
The dates are kept in the page's address, so you can copy it and send it: whoever opens it sees the same days.
On the Reports page: what was reported. Press Reports at the foot of the left column. It has three tabs, each with the same date choice:
- Field reports: the construction progress crews entered (the day of the work, the segment, the activity, the feet done and how many were added, who, and the note) and the photos and as-builts they added. Choose a Route or a segment to narrow it, and press Download CSV for a spreadsheet. An entry without a work date counts on the day it was entered.
- Edits and updates: every feature created or changed, with how many changes, what kind, and who made the last one. Show on the map turns on Changed between for the same days.
- Breaks and alarms: fibers marked Damaged, with the cable, the fibers, the segments it runs through, who marked them, and whether they are still damaged or repaired. Alarms from HarborLink's NOC will be listed here too once fault monitoring is connected.
On one feature. Press History at the bottom of the panel (see History) and choose the dates above the list. With Changed between on, History starts at the same days. Admins can choose dates on Admin → Audit log too (see System and audit log).
3Reading the selection panel
The panel on the right of the map (at the bottom of the map on a phone) shows the details of what you selected. Underlined names are links: click one to select that thing instead. The panel scrolls: long panels, like a cable with 72 ribbons, need scrolling to see everything.
A route segment
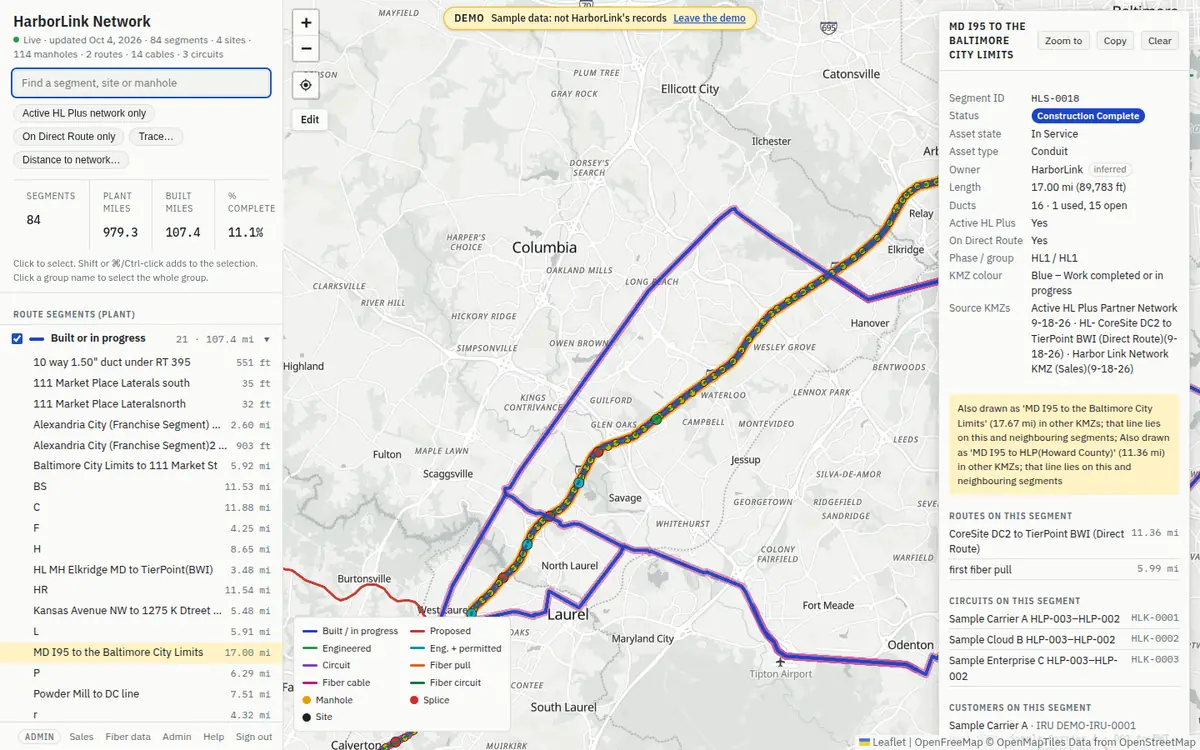
- Segment ID: its code. A drawn in app tag means someone drew it in the app; a sample tag means made-up demo data.
- Status: its lifecycle status, in its map colour. Asset state: whether it is in service. See Status colours.
- Asset type: Esri's kind of plant, such as Conduit or Duct Bank.
- Owner: who owns it. An inferred tag means the owner was worked out from the KMZ, not confirmed (HL2 segments are taken to be partner plant, under BG&E).
- Length as measured along the line; Measured if someone entered a measured length; Stated in KMZ if the KMZ's description gives one.
- Ducts: how many, how many are used and how many are open.
- Active HL Plus and On Direct Route: Yes or No.
- Phase / group, KMZ colour (Tom's legend wording), Notes, and Source KMZs (which KMZ files it is in).
- Routes on this segment, with the miles each rides on it; Circuits on this segment; Customers on this segment: who leases fibers on its cables. Click a customer to trace their fibers.
- How many manholes sit on it, its ducts, the cables on this segment, construction progress, photos and as-builts, and History.
A manhole or other structure
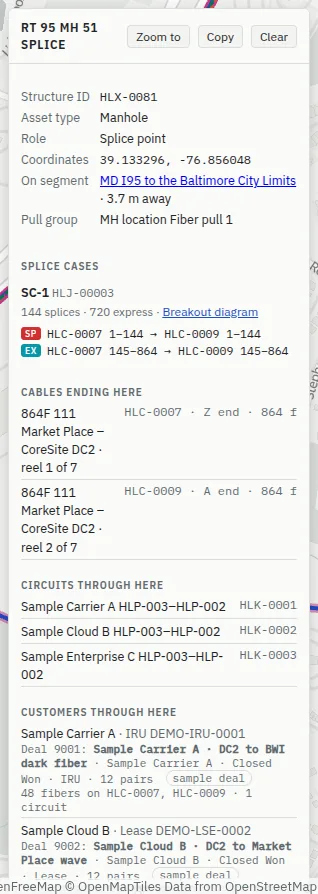
- Structure ID, Asset type (Manhole, Handhole, Vault…) and Role if the KMZ gives one: Splice point, Reel set-up, End of fiber pull or Estimated end of fiber pull.
- Coordinates (latitude, longitude), and On segment: the segment it sits on, if one is within 75 m, and how far away.
- Pull group: the KMZ folder it came from.
- Splice cases and slack loops in it, Cables ending here (which end, A or Z), Circuits through here and Customers through here.
- Photos and as-builts and History.
A site
A site is a building on the network, such as a data center. Its panel shows the Site ID, Type, coordinates, whether it is in the Active HL Plus network and on the Direct Route, its patch panels, the cables ending there, and the circuits and customers at the site.
A route
A route is a path from the KMZ that rides on the segments (like the Direct Route). Its panel shows its ID, type (Circuit or Fiber pull), length, how much of it lies on HarborLink's plant (On plant, in %), its source KMZ, and Rides on N segments with the miles and share of each. Routes are not edited in the app.
Ducts on a segment
A duct is a pipe in the ground that a cable runs through. Bigger ducts can hold smaller ones: a microduct casing holds several microducts; an innerduct sits inside a duct. A duct bank is the set of ducts laid together along a segment.
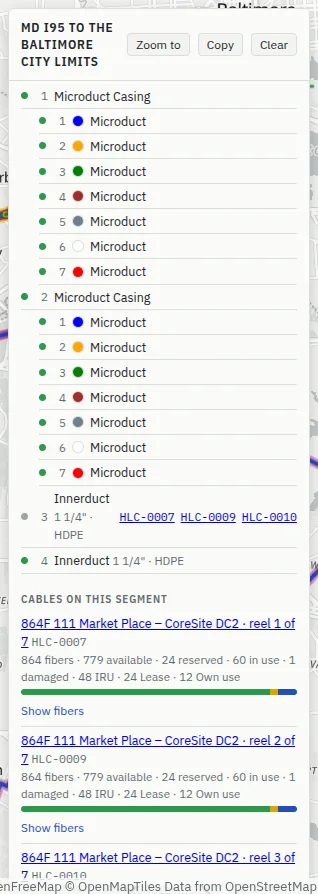
- The heading counts the ducts and how many are open (and reserved, if any). Casings that hold other ducts are not counted.
- Each row: a dot (green: open; grey: not available), its position number, its colour if recorded, its type, label, diameter and material, a reserved tag if it is held for someone (for example the City), and the codes of the cables in it.
- Ducts inside a casing are listed under it, indented.
A cable
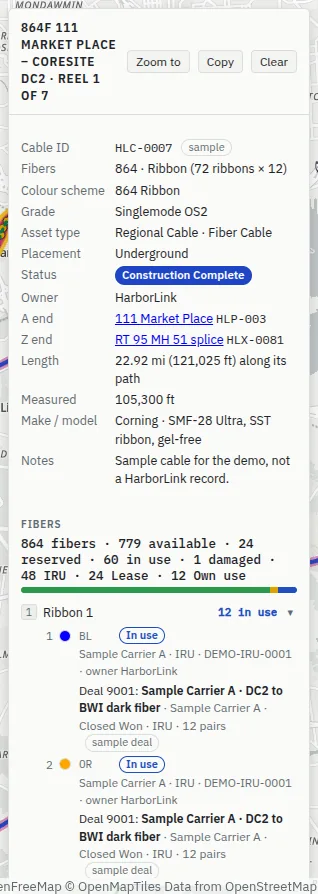
- Fibers: how many, and the layout: Loose tube (fibers in coloured buffer tubes of 12) or Ribbon (fibers bonded in flat ribbons of 12).
- Grade (for example Singlemode OS2), Placement (for example Underground), Status and Owner.
- A end and Z end: where the cable starts and ends, a site or a manhole. The A end is the start of its path and the Z end the finish.
- Length along its path, and Measured if entered; make and model, reels, purchase order, dates and notes.
- Fibers: the counts and the fiber table.
- Path: the segments it runs through, in order from the A end, with the duct it uses on each.
- Trace and breakout: a small trace form and the Breakout diagram link; then the circuits and customers on the cable.
A segment's panel lists the cables through it, each with its counts; press Show fibers to open its fiber table there.
Fibers: the fiber table
Every fiber in a cable has a status, shown in colour:
- Available: free to sell or use.
- Reserved: held for someone, for example while an IRU is being signed.
- In use: lit or leased.
- Damaged: not usable.
The line above the table sums them up, for example 864 fibers · 779 available · 24 reserved · 60 in use · 1 damaged · 48 IRU · 24 Lease · 12 Own use, with a coloured bar showing the same shares. The last three count the fibers under each kind of contract:
- IRU (indefeasible right of use): a long-term right to use the fibers, usually paid up front.
- Lease: the fibers rented for a term.
- Own use: HarborLink's own fibers.
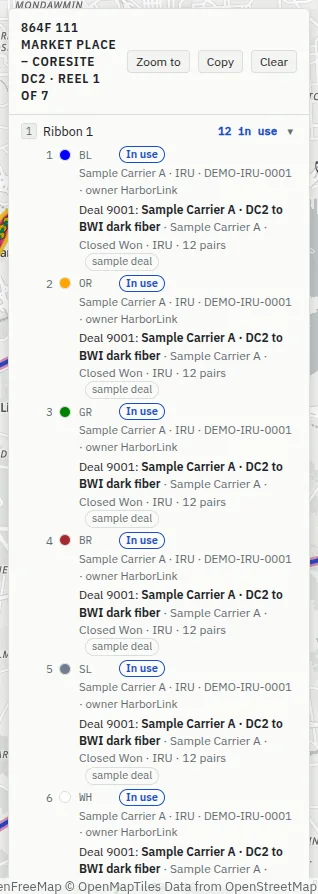
How do I see each fiber?
- In the fiber table, each row is a tube or ribbon, with how many of its fibers are available, reserved, in use or damaged.
- Press a row to open it. Each fiber shows its number, its colour, its status, and who has it: lessee, contract type, contract reference and owner, any note, and the HarborCRM deal it is linked to.
- Press the row again to close it.
The fiber colours (TIA-598)
Fibers and buffer tubes are coloured to the TIA-598 standard, in this order. Fiber 1 is blue, fiber 2 orange, and so on; after twelve the colours repeat with a stripe called a tracer (shown half and half, for example blue/black). Ribbons are not coloured: they are numbered.
- 1 Blue (BL)
- 2 Orange (OR)
- 3 Green (GR)
- 4 Brown (BR)
- 5 Slate (SL)
- 6 White (WH)
- 7 Red (RD)
- 8 Black (BK)
- 9 Yellow (YL)
- 10 Violet (VI)
- 11 Rose (RS)
- 12 Aqua (AQ)
Splice cases in a manhole
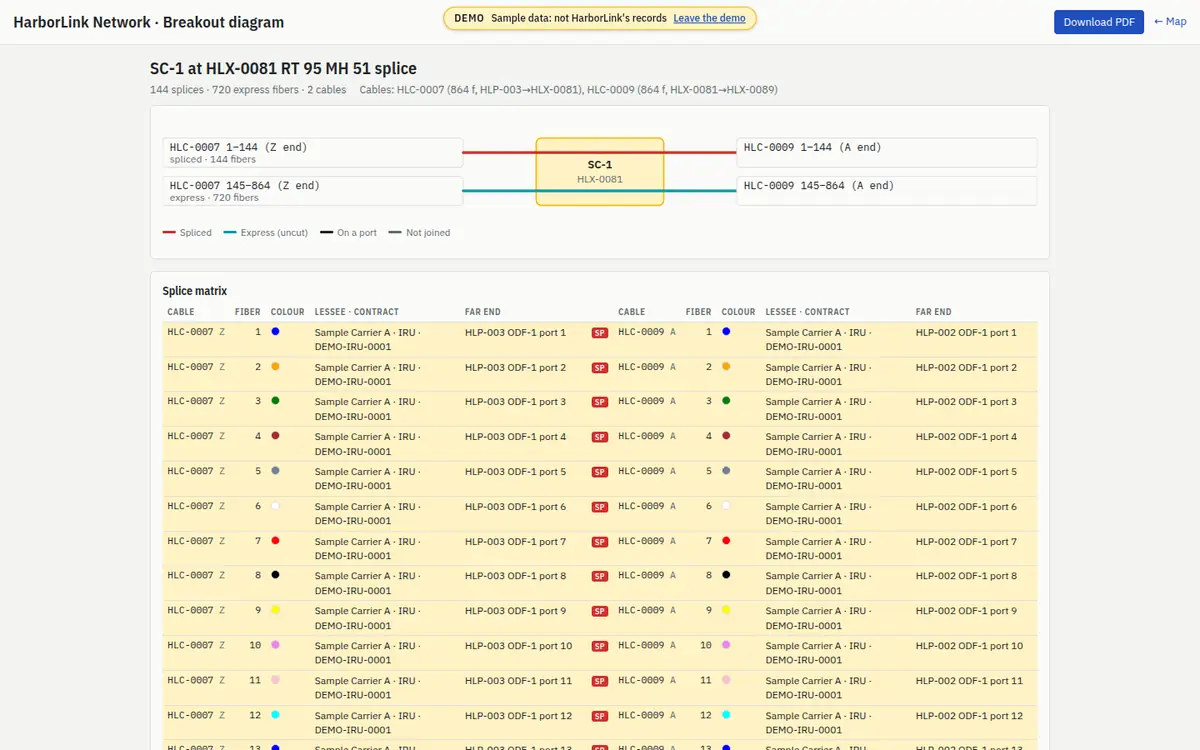
A splice case is the sealed enclosure in a manhole where fibers of two cables are joined. A splice joins a fiber of one cable to a fiber of another. An express fiber passes through the case uncut. A slack loop is spare cable coiled in a manhole.
A manhole's panel lists each splice case: its label (as written on the case, e.g. SC-1), its code (HLJ-…), how many splices and express fibers it holds, a Breakout diagram link, and what is joined, as ranges:
- SP
HLC-0007 1–144 → HLC-0009 1–144: fibers 1 to 144 of HLC-0007 are spliced to fibers 1 to 144 of HLC-0009. - EX
HLC-0007 145–864 → HLC-0009 145–864: fibers 145 to 864 pass through as express.
Where the KMZ marks a splice but no case is recorded, the panel says No splice case recorded yet. The KMZ marks a splice here.
Patch panels and ports at a site
A patch panel (often labelled ODF, optical distribution frame) is where cable fibers end at a site, each on a numbered port. Putting a fiber on a port is a termination. A patch cord is a short jumper plugged into the front of two ports.
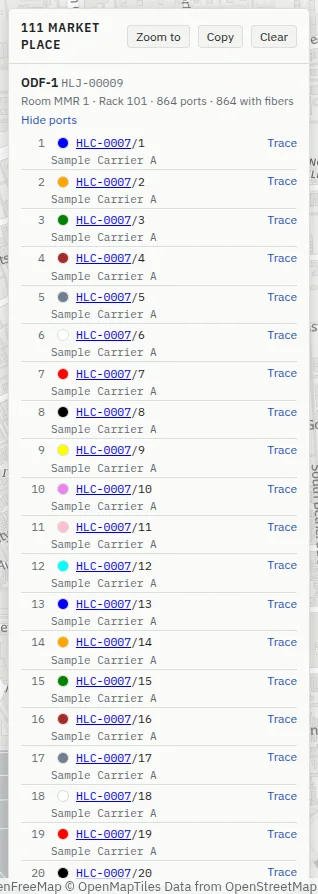
How do I see what is on each port?
- Select the site.
- Under Patch panels, find the panel (label, code, room, rack, ports, and how many have fibers).
- Press Show ports. Each port shows its number, its label, the fiber on its back (tube and fiber colours, then cable/fiber), what is patched into its front (⌒ panel:port), the lessee, and a Trace button.
A circuit
A circuit is a customer's service between two ports, running on fibers through splices along the way. Circuits are a group in the register and dotted green lines on the map.
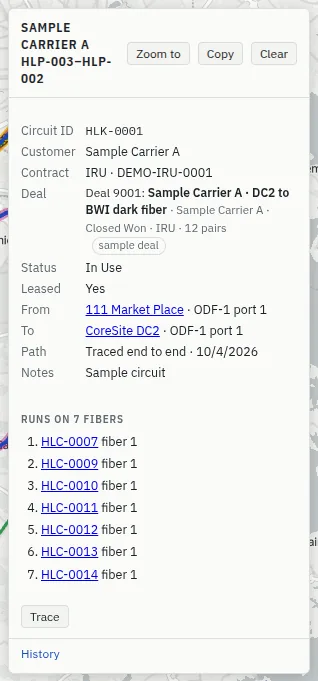
- Customer, Contract (type and reference), Deal (its HarborCRM deal, if linked), Status (for example In Use, Reserved, Pending Customer Connect), and whether it is Leased, with the lease dates.
- From and To: the site, panel and port at each end.
- Path: Traced end to end with the date it was last checked, or, in red, where the path now stops (for example after a splice was removed). The circuit is then tagged path broken wherever it is listed.
- Runs on N fibers: the cable and fiber on each stretch; and Trace to see its path on the map.
A circuit's customer is a name and a contract reference, and it can also be linked to its deal in HarborCRM.
How do I see who changed something?
- Select one segment, structure, site, cable or circuit.
- Scroll to the bottom of the panel and press History.
- Each change is listed with when, what (for example edit, retire, progress), who, and what changed from and to.
- To see only some days, choose them above the list (see What changed between two dates).
4In the field (phone)
Field mode is the same map on a phone or tablet: there is no separate app. Anyone can see where they are; adding things, progress and photos need an editor account and edit mode.
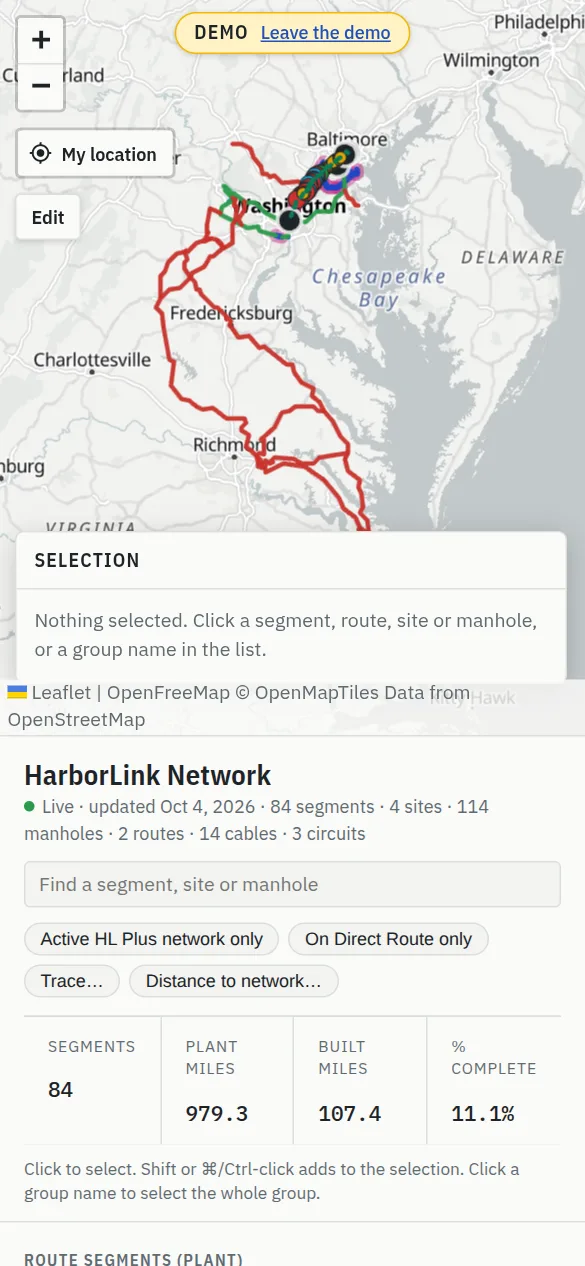
How do I show where I am?
- Press My location, under + and −.
- The first time, your phone or browser asks whether the site may use your location: allow it.
- A blue dot shows where you are, in a pale circle showing how accurate the position is, and the button shows the accuracy instead of its name, for example ±20 ft. The map centres on you, clear of the selection panel.
- Press the button again to centre on yourself again. Press × beside it to stop showing your position.
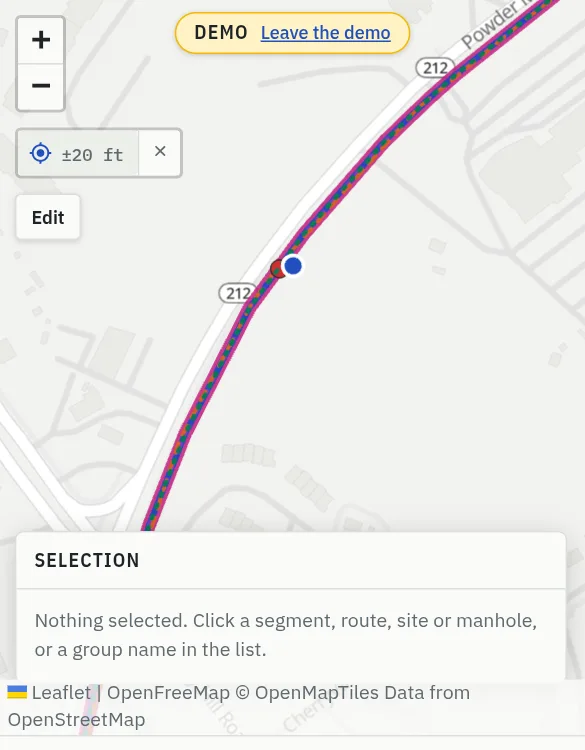
My location works on a desktop or laptop too. Without GPS, the browser places you from the Wi-Fi network, so the circle is usually larger.
If you see Location is blocked for this site, allow location for this site in your browser or phone settings and try again. If you see Location is not available inside this preview, the map is open inside Replit's preview pane, where browsers don't share your location: open the map in its own browser tab. If it says finding your position is taking too long, try with a clearer view of the sky.
How do I add a structure where I am standing?
- Press Edit; it turns blue and says Editing.
- Press + Here (Add at my location on a wider screen).
- A marker appears at your position, and the panel says how accurate it is, for example At your position, ±20 ft. If the fix is poor (worse than about 100 ft), it says so: drag the marker to the right spot if you can see it on the map.
- Choose the Asset type (Manhole, Handhole, Vault…) and a Role if it has one, and fill in a Name and anything else you know.
- Press Create. It gets the next
HLX-code and appears on the map.
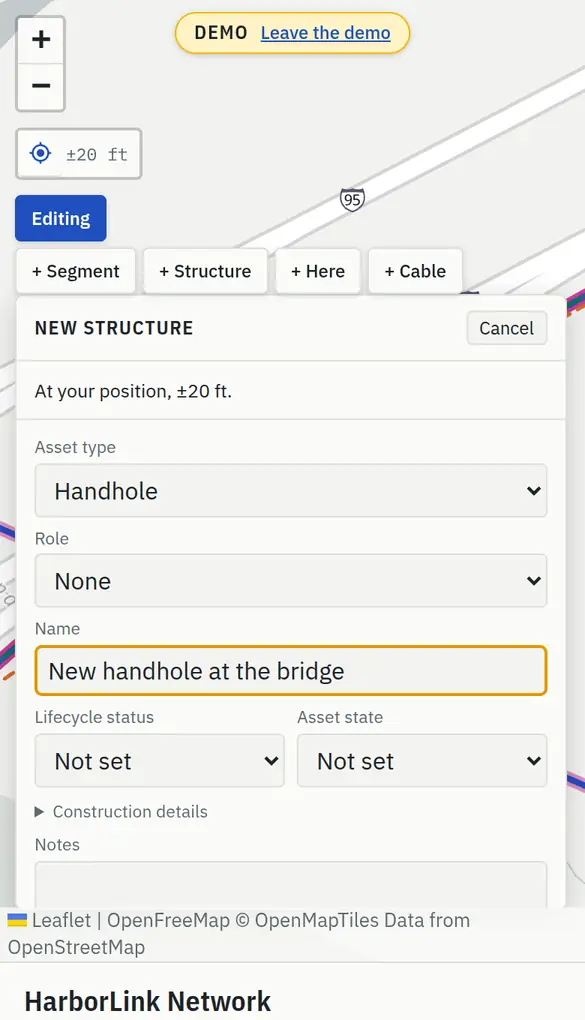
To move an existing structure to where you stand, select it in edit mode and press Move to my location, then Save position.
How do I take a photo or add an as-built?
Photos and as-builts (drawings of what was actually built) can be added to segments and to manholes and other structures (not yet to sites).
- In edit mode, select the segment or structure.
- Scroll the panel to Photos and as-builts.
- Press Take photo: on a phone this opens the camera. Or press Add as-built to choose an image or a PDF.
- The panel shows Uploading…, then the file appears in the list with its size, date and who added it. Photos are made smaller on the phone before they are sent, to save data.
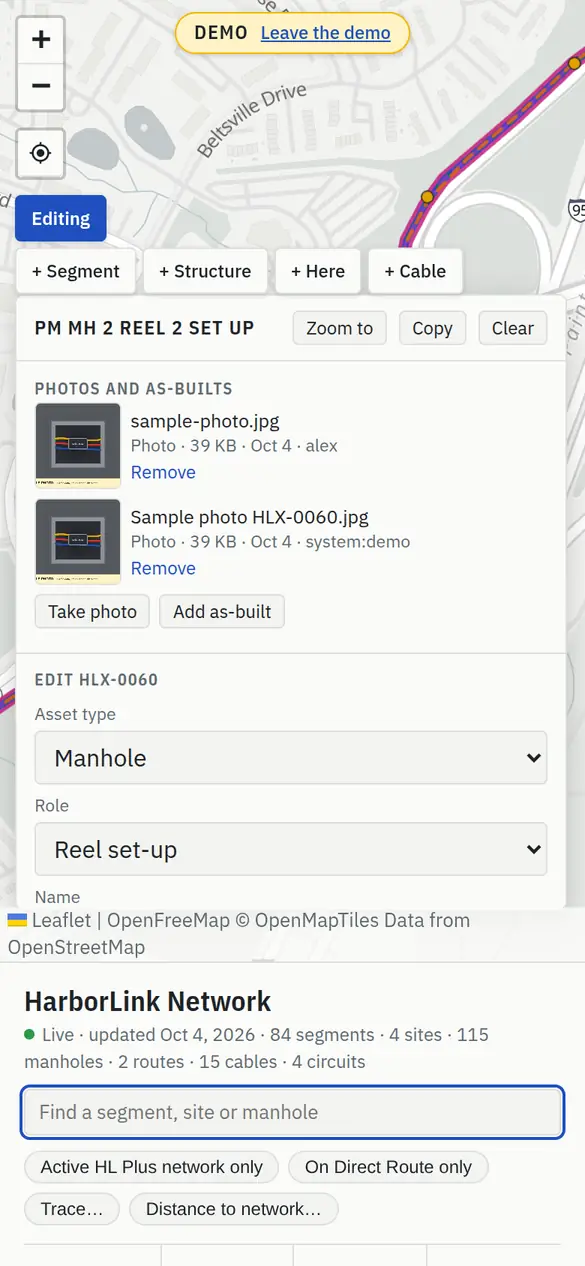
Tap a photo to open it full size. Remove deletes the file for everyone, after you confirm.
How do I record construction progress?
Construction progress is the footage done on a segment for each of four activities: Conduit placed, Cable pulled, Spliced and Tested.
- In edit mode, select the segment.
- Under Construction progress, type the total feet done so far for each activity that moved on (not just today's feet). All fills in the segment's whole length.
- Check the Work date (it starts as today) and add a Note if you like.
- Press Save progress. The bars update.
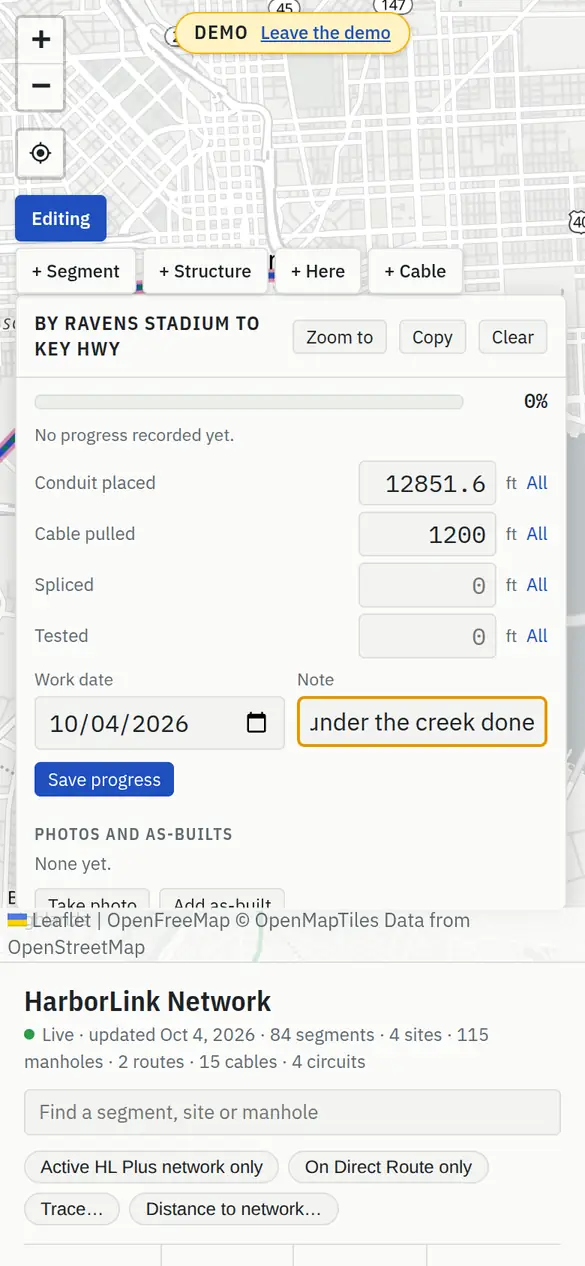
Made a mistake in the date or note? Press Correct the last entry's date or note, change them, and save; the footage is locked meanwhile. To correct footage, type the right total and save again.
The panel shows a bar for the whole segment and one per activity, with feet done (for example 1,200 ft / 12,852 ft), and who made the last entry. Progress never changes the segment's status: when a segment is finished, an editor changes its status.
What if I lose signal?
Every save goes straight to the server. If the connection drops, the save fails with Not saved: no connection, and what you entered stays in the form: press Retry when you have signal again. Nothing is stored on the phone to send later, so a crew without signal has to wait until they have one.
5Editing
Editors and admins can change the network. Every save is written at once, with your name and the time, and logged; nothing is ever deleted (see Retire).
How do I turn on edit mode?
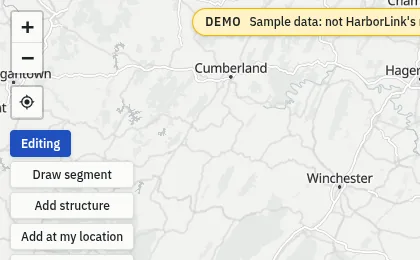
- Press Edit, under the zoom and My location buttons. It turns blue and says Editing.
- The tools appear beside it: Draw segment, Add structure, Add at my location and New cable (on a phone: + Segment, + Structure, + Here, + Cable).
- Select one thing to edit it; its form appears in the panel.
- Press Editing again to leave edit mode.
How do I change a segment's, structure's or site's details?
- In edit mode, select it.
- Scroll to the bottom of the panel, to Edit code.
- Change the fields. For a segment: name, asset type, lifecycle status, asset state, owner, phase, group, notes, and under Construction details the install and in-service dates, duct counts and measured length. For a structure: asset type, role, name, statuses, owner, install date and notes. For a site: name, type and notes.
- Press Save. Saved. appears and the map redraws, keeping your view.
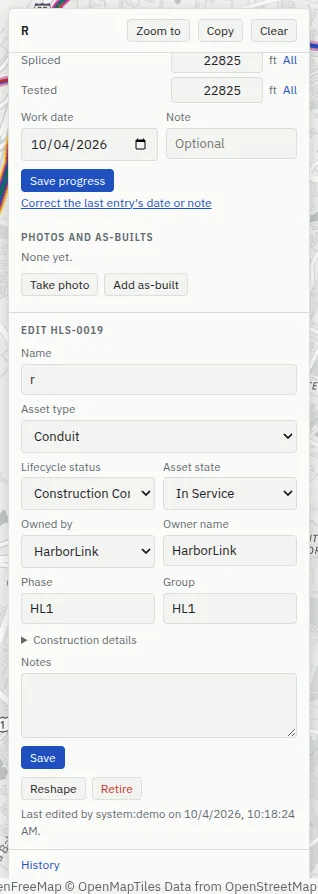
Once a segment has ducts recorded, its duct counts follow the ducts: change the ducts instead. Routes come from the KMZ and are not edited in the app.
How do I draw a new segment?
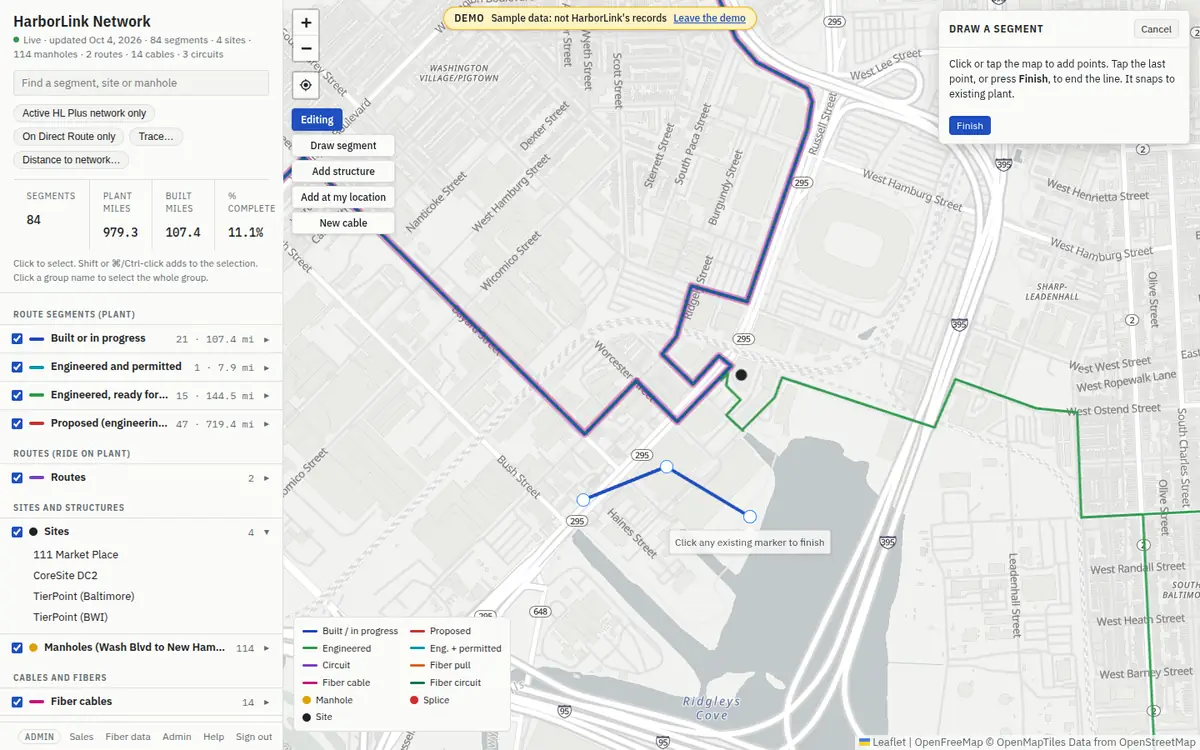
- In edit mode, press Draw segment.
- Click or tap the map at each point along the line. The line snaps to existing plant when you are close to it.
- Tap the last point again, or press Finish, to end the line. A line needs two points.
- Adjust the line if needed, then fill in its details. A Lifecycle status is required.
- Press Create. It gets the next
HLS-code and a drawn in app tag. Cancel stops without saving.
How do I reshape a segment?
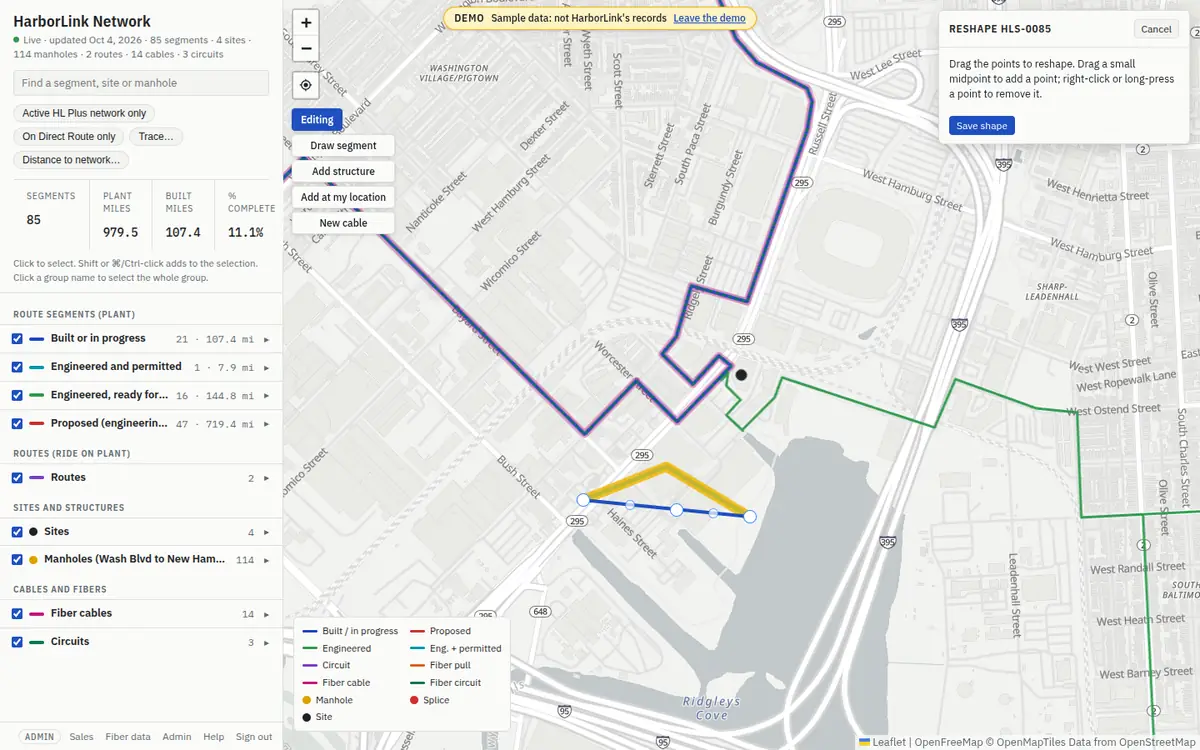
- In edit mode, select the segment and press Reshape.
- Drag its points. Drag a small midpoint to add a point. Right-click a point (long-press on a phone) to remove it. On a Google map, a point is picked up only when you press on it; pressing beside the line moves the map.
- Press Save shape. The segment's length, the structures snapped to it and the routes on it are worked out again.
How do I add or move a structure?
- To add one: in edit mode, press Add structure, then tap the map where it is. Drag the marker to the exact spot if needed, fill in its details and press Create. (To use your GPS position instead, see Add a structure where I am.)
- To move a structure or site: select it, press Move, drag the marker, and press Save position. On a structure, Move to my location puts the marker at your GPS position.
How do I retire a feature?
Retiring is how things are removed: the feature leaves the map but stays in the record, and its code is never used again. Nothing is ever deleted.
- In edit mode, select it and press Retire.
- The browser asks you to confirm, with a box for a reason (optional, but it helps the next person). Press OK.
Some things must be cleared first, and the app says what: a segment that a cable runs through; a manhole or site holding a splice case or panel; a splice case or panel with anything in it; a cable with fibers reserved, in use, spliced or on ports. Bringing a retired feature back cannot be done in the app yet: ask whoever runs the app.
What does “changed by someone else” mean?
Two people can have the same thing open. If someone saves a change after you opened it, your save is refused rather than silently overwriting theirs:
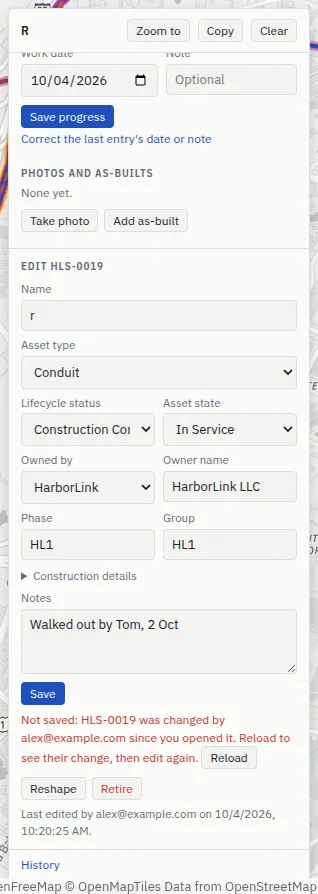
- Note what you were changing.
- Press Reload. The panel shows their change. If you were moving or reshaping something, or changing a cable's path, that ends too.
- Make your change again and press Save.
The same happens for ducts, cables, fibers, splices, panels, circuits and progress. Other messages you may see:
- Not saved: no connection. What you entered is still here. Press Retry when you have signal.
- No changes to save. Nothing in the form differs from what is recorded.
- Saved, but the map could not refresh. Your change is saved; reload the page to see it.
6Ducts, cables and fibers
All of this needs edit mode. To read ducts, cables and fibers, see section 3. To load many at once from a spreadsheet, see Collecting data by CSV.
How do I add ducts to a segment?
A whole duct bank at once:
- In edit mode, select the segment.
- Under Ducts, open Add a duct bank… and choose one of HarborLink's known duct banks:
- I-95: two 7-way microduct casings and two 1.25" HDPE innerducts (the “16 ducts” of the I-95 build).
- DC: twelve 1.5" PVC ducts.
- Baltimore: twenty ducts, four reserved for the City (ducts 17–20 are marked until HarborLink says which four).
- Arlington: ten 1.5" ducts in the bore under Route 395.
- River crossing: one 8" HDPE duct, the casing pipe at the crossing; add the ducts inside it afterwards.
- Confirm. The ducts are added and the segment's duct counts follow.
One duct at a time:
- Press Add duct or microduct. A form opens headed New duct, innerduct or microduct on HLS-….
- Choose the Type (Duct, Innerduct, Microduct casing, Microduct) and Inside: The segment, or a duct already there that can hold it, listed by type, position and code (for example Duct 2 · HLD-00038). Only ducts that can hold the chosen type are listed, and the list changes when you change the type. A duct that already carries a cable is shown greyed out with the cable's code: nothing can go inside it.
- An innerduct, microduct casing or microduct normally sits inside a duct. If only one duct on the segment can take it, Inside chooses it for you; if there are several, the form asks you to Choose the duct it goes in. You can still leave it on The segment, for example for a direct-buried microduct.
- Fill in what you know: Position (blank takes the next number), Label, Colour (a TIA-598 code such as BL), Diameter, Material, Reserved for (for example City), lifecycle status and notes.
- Press Add.
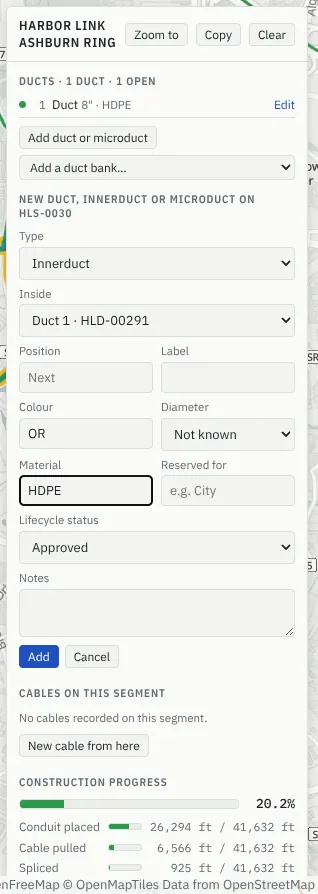
To change or retire a duct, press Edit beside it, then Save or Retire.
How do I add a microduct inside a duct?
Press Add duct or microduct, as for one duct at a time: choose Type Microduct and, under Inside, the duct, microduct casing or innerduct it sits in (for example Duct 2 · HLD-00038). If only one can take it, it is chosen for you; if there are several, Choose the duct it goes in shows under Inside until you pick one. One that carries a cable is greyed out. If Inside is left on The segment, the microduct is saved loose in the segment, not in a duct: do that only for one that really lies in the segment, such as a direct-buried microduct. Once added, it is listed indented under its duct. For many at once, give the duct in the parent column of the Ducts spreadsheet. There is also an illustrated how-to (PDF).
How do I record a cable?
- In edit mode, press New cable (+ Cable on a phone), or select a segment and press New cable from here.
- Click the cable's segments on the map in order, from the A end. Each is highlighted and listed in the panel. Click one again to take it out, or use ↑ ↓ × in the list.
- Click a site or structure to set the A end, then another for the Z end. (Or type their codes,
HLP-…orHLX-…; the box suggests them.) - If ducts are recorded on a segment, choose the duct the cable is in. Ducts already used are marked (not available).
- Fill in the cable: Name, Fibers (how many: required), Layout, Grade, Placement, and under Make, reels and dates the rest. Corning 864 SST-Ribbon (order 22-66082) fills in the brief's cable: 864 fibers, ribbon, Singlemode OS2, Corning, order 22-66082.
- Press Create cable. Its fibers are created with it, all Available. Cancel stops without saving.
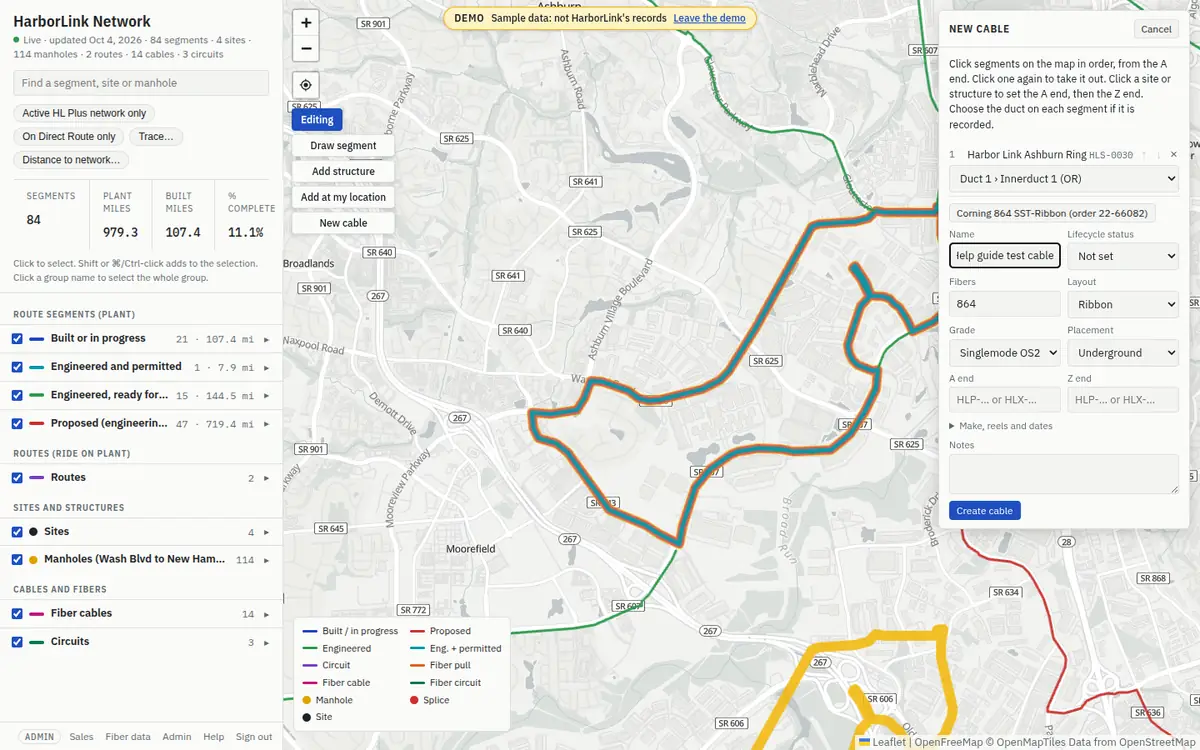
If the segments are not in order, the save still works but a message lists the gaps, for example Saved. The path has gaps: … Check the segments are in order.
How do I change or retire a cable?
- In edit mode, select the cable. Its edit form is at the bottom of the panel.
- Change its details and press Save. A cable's fiber count and layout cannot change once created.
- To change its route, press Change path, pick the segments again as above, and press Save path.
- To retire it, press Retire. This is refused while any of its fibers are reserved, in use, spliced or on ports: release them first.
How do I assign fibers to a customer?
- In edit mode, select the cable. The Set fibers form is above its fiber table.
- Press Set beside a tube or ribbon to fill in its range, or tap a single fiber. Or type From and To.
- Choose the Status and fill in the Lessee, Contract (IRU, Lease or Own use), Contract ref, Owner, the HarborCRM deal (see Link fibers to a deal) and a Note, as needed.
- Press Apply. Every fiber in the range is set at once, and the counts update.
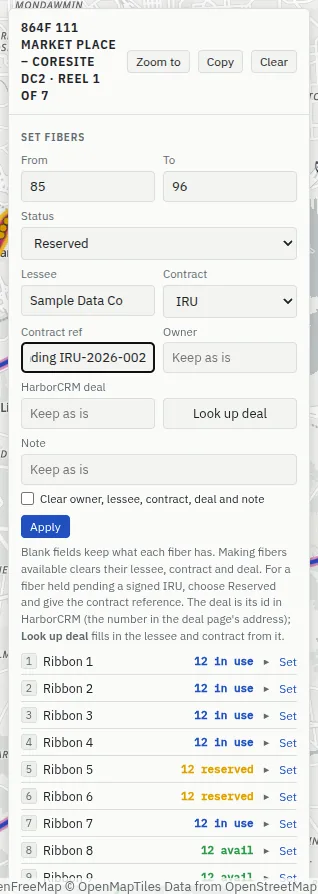
- Blank fields keep what each fiber already has.
- Making fibers Available clears their lessee, contract and deal.
- Tick Clear owner, lessee, contract, deal and note to empty those.
- A fiber held for an IRU that is not signed yet: choose Reserved and a contract reference such as pending IRU-2026-002.
7Splices, ports, trace and diagrams
Reading splice cases and panels is in section 3. Recording them needs edit mode; trace and breakout diagrams work for everyone.
How do I record a splice case and its splices?
- In edit mode, select the manhole.
- Press Add splice case, give its Label as written on the case (e.g. SC-1) and press Add. (Add slack loop records spare cable: which cable and how many feet.)
- On the case, press Splice.
- Choose Cable A (the cables that end at this manhole are listed; Another cable… lets you type a code) and its first and last fiber, From and To.
- Choose Cable B and its first fiber. Leave From blank to use the same numbers as cable A.
- Leave Cable A end and Cable B end as The one that ends here, unless both ends of a cable are at this manhole.
- Add a Note if useful (e.g. tray 3, Millennium sheet 12) and press Splice.
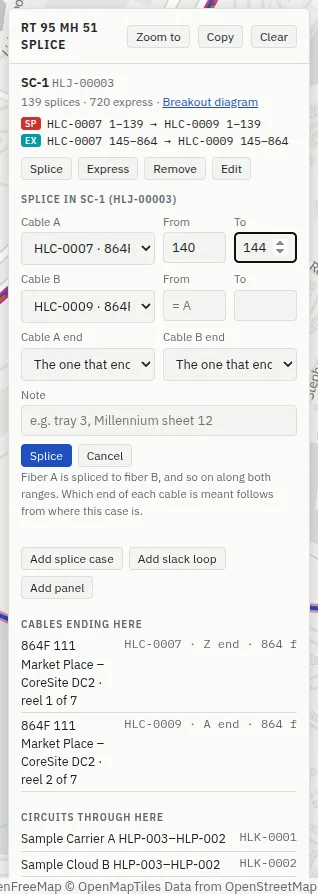
Fiber A is spliced to fiber B, and so on along both ranges. Splice sheets list splices the same way.
- Express records fibers that pass through the case uncut, the same way (Record express). Use it when a cable is recorded as two cables either side of the case.
- Remove takes splices and express fibers off a range of one cable, for example when the case is re-entered.
- Edit changes the case's label and notes, or retires it once it is empty.
How do I record a patch panel, put fibers on ports, or add a patch cord?
- In edit mode, select the site and press Add patch panel.
- Give its Label as on the panel (e.g. ODF-1), the number of Ports, the Port type, Room / cage and Rack, and under Building, aisle, chassis, slot, card anything else on the label. Press Add. Its ports are numbered from 1.
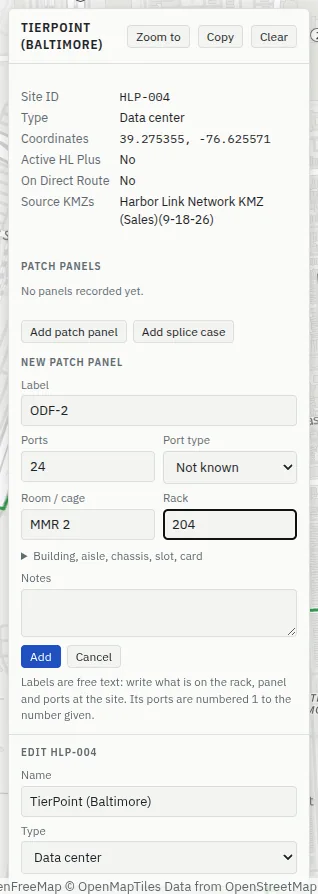
Fibers on ports (terminations):
- On the panel, press Fibers on ports.
- Give From port (and To port), the Cable, and From fiber (and To fiber). The first port takes the first fiber, and so on; leave either “To” blank and it follows the other.
- Press Terminate.
A patch cord between two ports at the site: press Patch cord, give the Port, choose To panel and To port, and press Patch.
Remove takes fibers off a range of ports, or removes the patch cord in one port. Label beside a port (in Show ports) renames that port. Edit changes the panel; fewer ports retires the last ones, if nothing is on them.
How do I trace fibers?
A trace follows fibers end to end: port → cable fiber → splice case → next cable … → port, and shows the path on the map. You can trace:
- A cable's fibers: on the cable's panel, under Trace and breakout, give From and To fibers, or a tube or ribbon number, or leave them blank for all, and press Trace.
- A port: press Trace beside the port in Show ports.
- A customer: click their name under Customers on this segment (or through here, at this site, on this cable).
- A circuit: press Trace on the circuit's panel.
- A HarborCRM deal: every fiber and circuit linked to it (see Trace a deal).
- Anything, from the Trace… button under the search box (see below).
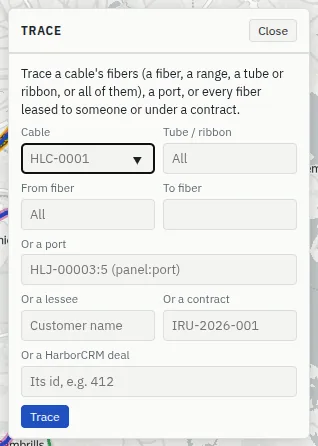
How do I use the Trace… button?
- Press Trace… under the search box.
- Fill in one of: a Cable (with a Tube / ribbon, or From fiber and To fiber, or neither for all); Or a port, written as panel code:port, e.g.
HLJ-00009:5(the panel's code is shown beside its label); Or a lessee; Or a contract; Or a HarborCRM deal (its number). The boxes suggest cables, lessees and contracts as you type. - Press Trace.
Reading a trace
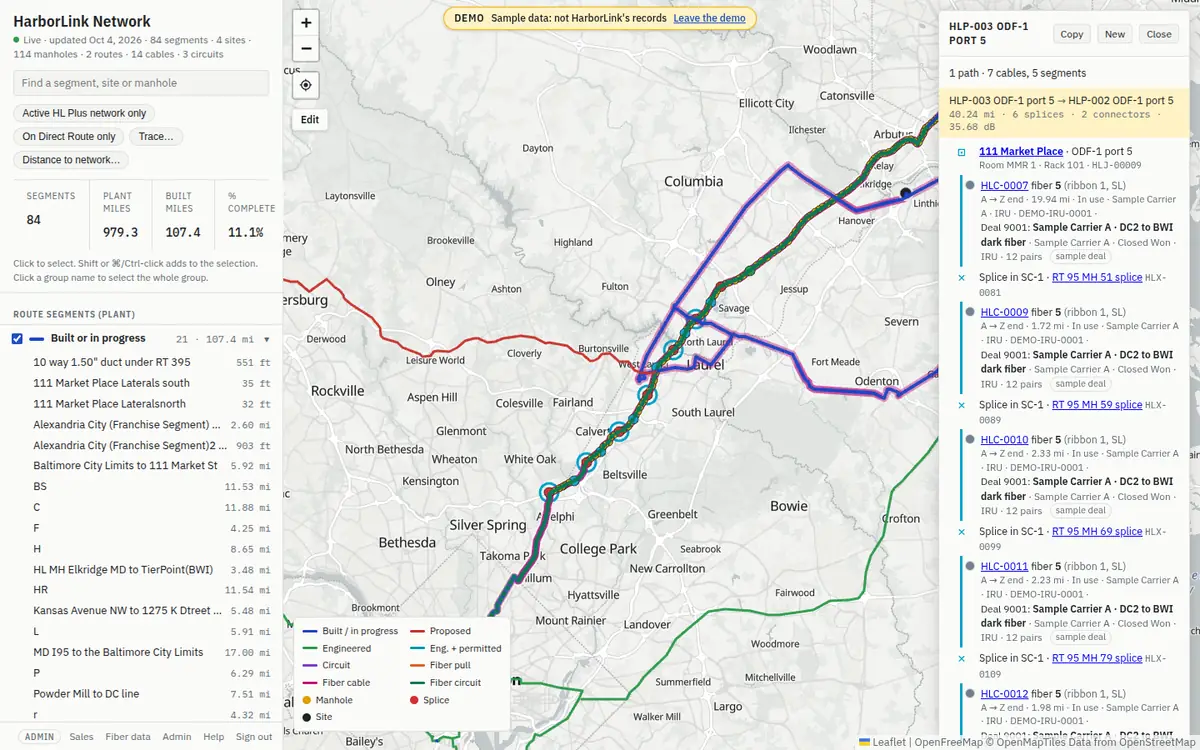
- The panel title says what was traced; below it, how many paths and the cables and segments they use.
- Each path has one line, for example HLP-003 ODF-1 port 5 → HLP-002 ODF-1 port 5 · 40.24 mi · 6 splices · 2 connectors · 35.68 dB. Press it to open its steps:
- ⊡ a port: site, panel and port, room and rack;
- a fiber: the cable, fiber number, tube or ribbon and colour, which way it runs (A → Z end), its length, status, lessee and deal;
- ✕ a splice, or ═ express (uncut), in a splice case at a manhole;
- ⌒ a patch cord;
- ○ where the path stops: Not joined at a manhole (no splice recorded there), or Not joined (cable end not recorded).
- The path is drawn on the map in bright cyan. Click a name in the steps to zoom to it.
- Copy puts the steps on the clipboard as text; New opens the Trace form; Close ends the trace. Selecting something else also closes it.
The loss budget (in dB, decibels) is a planning figure from the TIA-568.3-D maximums: 0.5 dB per km of fiber, 0.3 dB per splice, 0.75 dB per connector pair (one per port). Express fibers are uncut, so add nothing. It is not a measurement.
How do I record a circuit?
- In edit mode, trace a path that starts and ends on ports (for example, trace a port).
- Open the path and press Record as a circuit.
- The form is filled in from the trace: a Name from the two sites, and the Customer, contract and HarborCRM deal from the fibers. Check them; set the Status, whether it is Leased, and the lease dates.
- Press Record circuit. It gets an
HLK-code and appears in the Circuits group.
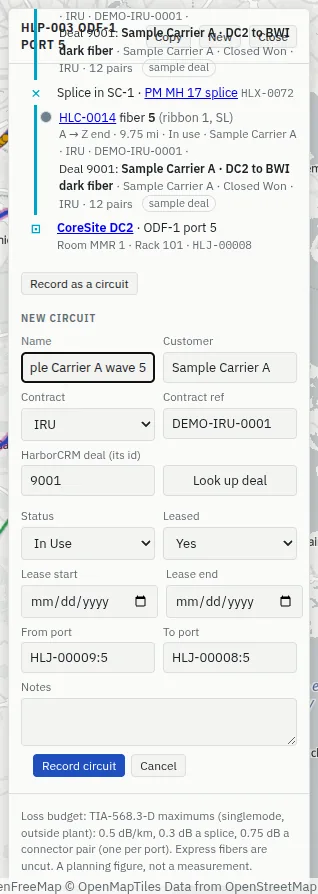
To change a circuit, select it in edit mode and use the form at the bottom of its panel. To move an end, type a new port as panel code:port; the path is traced again. Retire retires the circuit; its fibers are not changed. Whenever a splice, termination or patch cord changes, every circuit is traced again, so a broken path shows straight away.
How do I get a breakout diagram or a PDF of one?
A breakout diagram shows where every fiber goes and who owns or leases it, for a cable, a splice case or a site.
- Press Breakout diagram: on a splice case (in a manhole's panel), beside Patch panels (in a site's panel), or under Trace and breakout (in a cable's panel). It opens in a new tab.
- Read it:
- a cable: what each range of fibers is joined to at the A end (left) and Z end (right), its owners and lessees, and every fiber with where its path ends each way;
- a splice case: its splice matrix (which fiber of cable A goes to which fiber of cable B), and what is not spliced there;
- a site: each patch panel with every port, its fiber, lessee, where the path ends, and what is patched to it.
- Press Download PDF. Your browser's print window opens: choose Save as PDF as the printer. Pages are landscape, in light colours, with the table headings repeated on each page.
8Sales: distance, availability and deals
Three things for selling fiber: how far an address is from the network, what can be sold on each route, cable and segment, and the HarborCRM deal each customer's fibers belong to. Everyone can use them; linking deals needs an editor account.
How far is an address from the network?
- Press Distance to network… under the search box.
- Type the address, e.g. 111 Market Place, Baltimore, MD. Give the town or ZIP code too.
- Press Enter (or Search). It searches only then, never while you type.
- Read the answer in the panel; the map zooms to the address.
- Copy puts the answer on the clipboard as text; Close ends it.
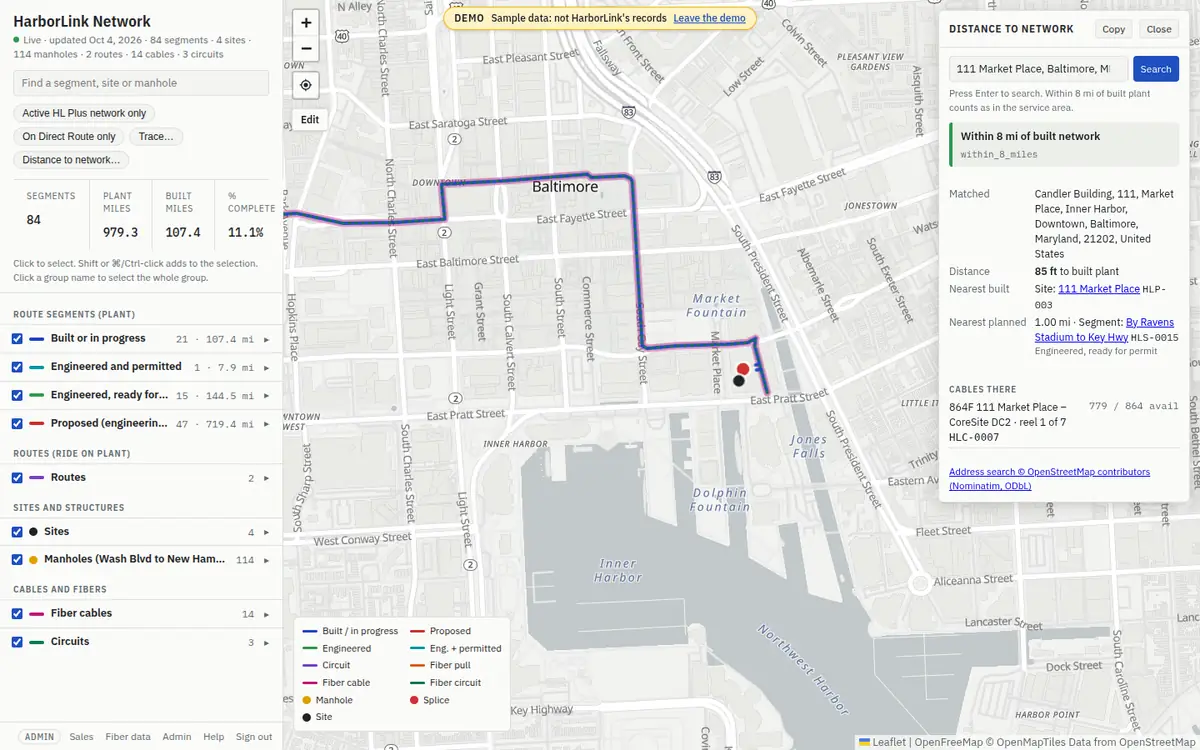
What the panel shows:
- The verdict, worded as on HarborLink's website, which counts an address within 8 miles of built plant as in the service area:
- Within 8 mi of built network (
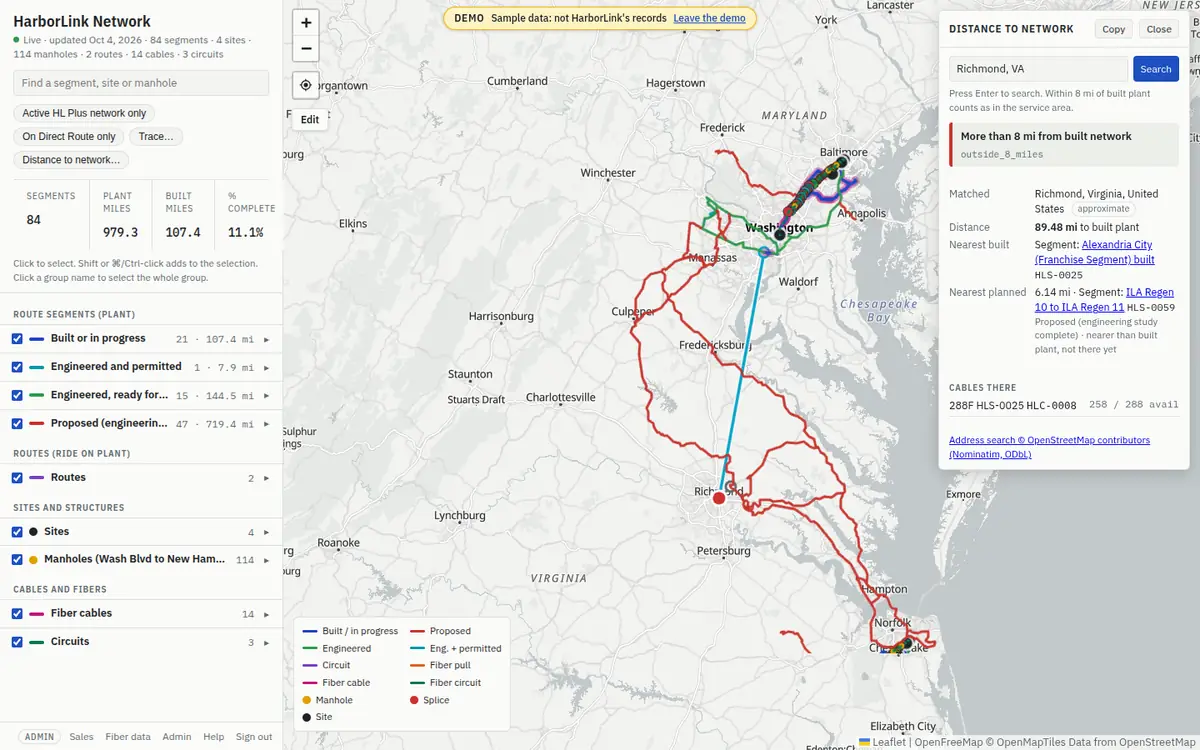
within_8_miles); - More than 8 mi from built network (
outside_8_miles); - Address not found (
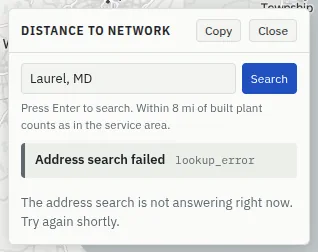
no_match): nothing matched; add the town or ZIP code; - Address search failed (
lookup_error): the address service did not answer; try again shortly.
- Within 8 mi of built network (
- Matched: the address found. An approximate tag means only a street or a town matched, not the exact address.
- Distance to the nearest built plant (a built or in-progress segment, a manhole on one, or a data center a built segment or cable reaches), and Nearest built: which one. On the map: a solid cyan line from the address (red dot) to it.
- Nearest planned: the nearest planned or proposed plant, with its status. When it is nearer than built plant, the panel says nearer than built plant, not there yet and the map draws a grey dashed line to it.
- Cables there: the cables on the nearest built plant, each with available / total fibers. Click one to zoom to it.
- Limits. Each person can look up 30 new addresses in 10 minutes. An address looked up before answers at once from memory (the panel says looked up before) and does not count. Over the limit, the panel says how many minutes to wait.
- Where addresses come from. The address search is OpenStreetMap's free service; the panel credits it (Address search © OpenStreetMap contributors), as its terms ask.
Which fibers can be sold? The Sales page
- Press Sales at the bottom of the map's left column. The Fiber availability page opens.
- Choose a tab: Routes, Cables, Segments, or All.
- Narrow it if you like: Find (an ID or part of a name), Status (Built or in progress, or Planned or proposed), At least available (a number of fibers), and With fiber only. The table follows as you type.
- Press Download CSV for the same rows, with the same filters, as a spreadsheet.
- Click an ID to open that route, cable or segment on the map.
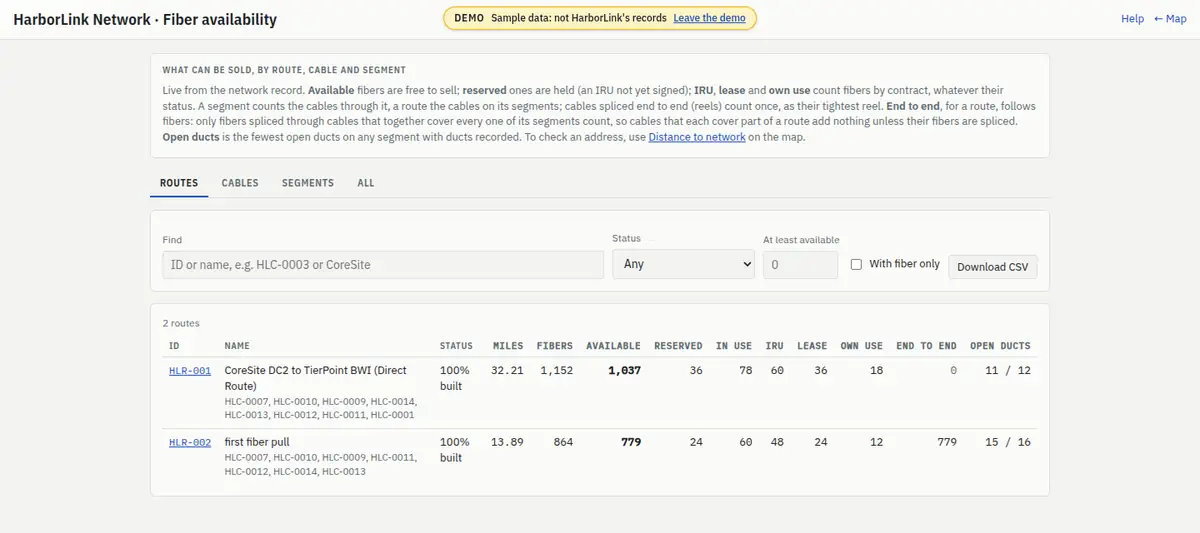
The columns:
| Column | Means |
|---|---|
| Status | A segment's or cable's lifecycle status; for a route, how much of it is built (e.g. 100% built). |
| Miles | Its length. |
| Fibers | All fibers: a segment counts the cables through it, a route the cables on its segments. Cables spliced end to end (reels of one run) count once, as the reel with the fewest available fibers. |
| Available | Free to sell. |
| Reserved, In use | Held (for example an IRU not yet signed), and lit or leased. |
| IRU, Lease, Own use | Fibers under each kind of contract, whatever their status. |
| End to end | For a route: the available fibers that run all the way along it, joined through cables and splices that together cover every one of its segments. Fibers on a cable that covers only part of the route do not count unless they are spliced on to the rest. |
| Open ducts | The fewest open ducts on any of its segments with ducts recorded, out of the ducts there (e.g. 11 / 12). A * means ducts are recorded on only some of its segments. |
Why the Direct Route shows 0 end to end. In the demo, the Direct Route runs on the spliced 864-fiber backbone and on a separate 288-fiber cable, HLC-0001, on one of its segments. Nothing is recorded joining HLC-0001 to the backbone, so no fiber is known to run the whole route: Available is 1,037 but End to end is 0. The first fiber pull, covered only by the spliced backbone reels, shows 779 end to end. A route made of separate cables shows 0 until the splices joining them are recorded (see Splice cases and splices).
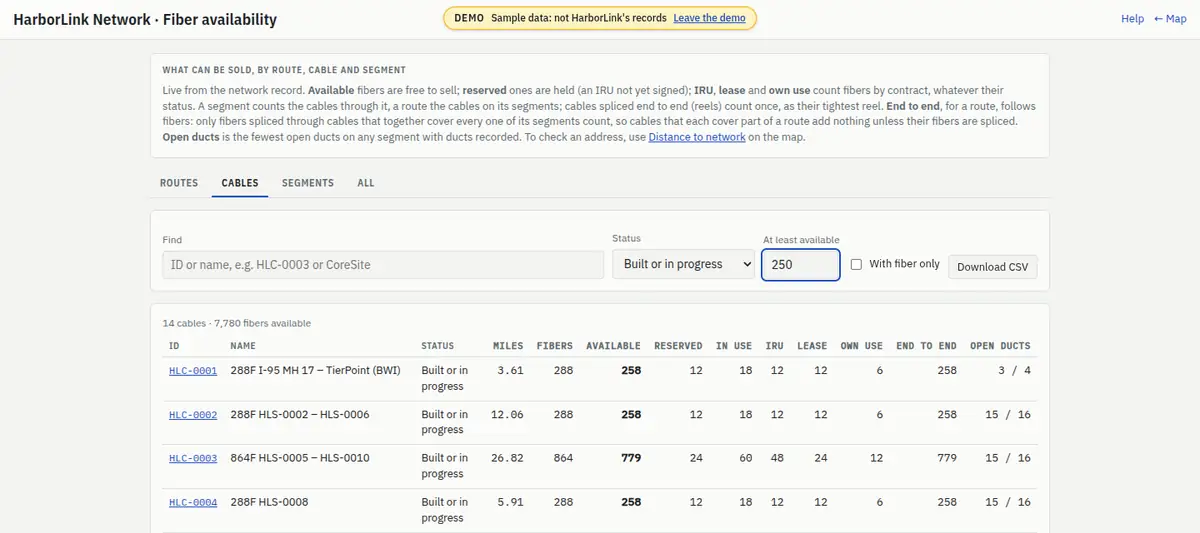
HarborCRM deals
A deal is a sale in HarborCRM, HarborLink's sales system. Fibers and circuits can be linked to their deal by its deal number: the number at the end of the deal page's address in HarborCRM (for …/deals/412, it is 412).
Where deals show
Wherever fibers or circuits are listed, a linked deal shows as Deal 9001: Sample Carrier A · DC2 to BWI dark fiber · Sample Carrier A · Closed Won · IRU · 12 pairs (name, company, stage, type and pairs):
- in a cable's fiber table, under each fiber;
- on a circuit's panel, in the Deal row;
- in the Customers on this segment (or through here, at this site, on this cable) lists;
- in the steps of a trace.
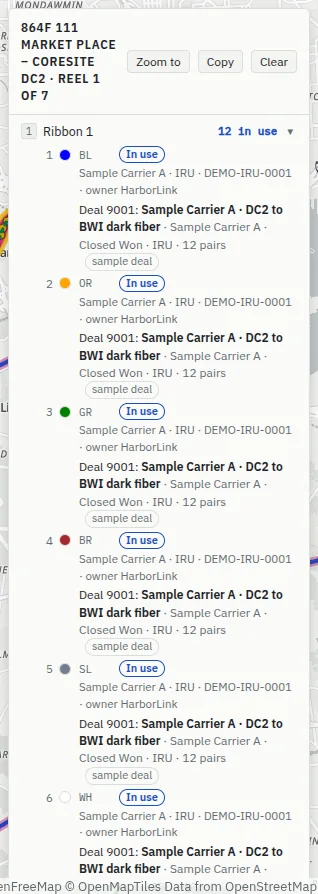
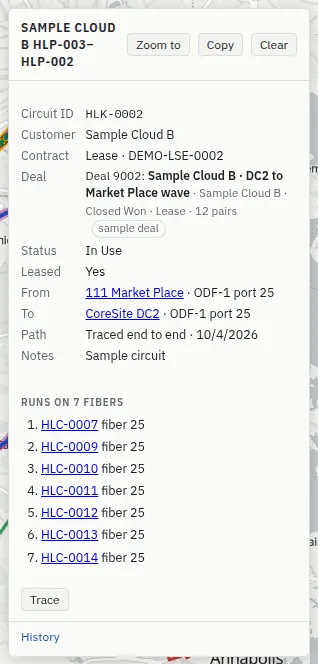
When HarborCRM is connected, the deal's name links to it in HarborCRM (↗). A tag says when what you see is not live: HarborCRM unreachable; as of a date (the last copy read, while HarborCRM does not answer), no longer in HarborCRM, or sample deal in the demo.
Viewers see the labels of deals that fibers or circuits are linked to, and nothing else from HarborCRM. Only editors can look a deal up.
How do I link fibers to a deal?
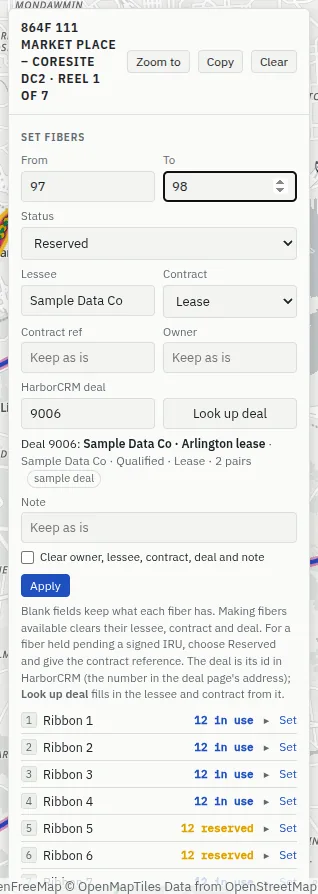
- In edit mode, select the cable and use its Set fibers form (see Assign fibers): fill in From and To.
- Type the deal number in HarborCRM deal and press Look up deal.
- The deal appears under the box, and the Lessee (the deal's company) and Contract (IRU or Lease) are filled in from it if they were empty. Change them if they are not right.
- Choose the Status and press Apply.
- If HarborCRM has no such deal, it says HarborCRM has no deal 12345., and the link is refused.
- If HarborCRM cannot be asked (it is down, or not connected), the link is still saved, unchecked: the map says Saved. The HarborCRM deal id was not checked: … Check the number in HarborCRM.
- Making fibers Available clears their deal, as it clears their lessee. Tick Clear owner, lessee, contract, deal and note to remove a deal on purpose.
- A circuit's form has the same HarborCRM deal box and Look up deal button, which fills in the Customer and Contract. Recording a circuit from a trace carries the fibers' deal over.
- The Fiber assignments CSV (see Collecting data by CSV) has a
crm_dealcolumn. Deal numbers loaded that way are not checked with HarborCRM.
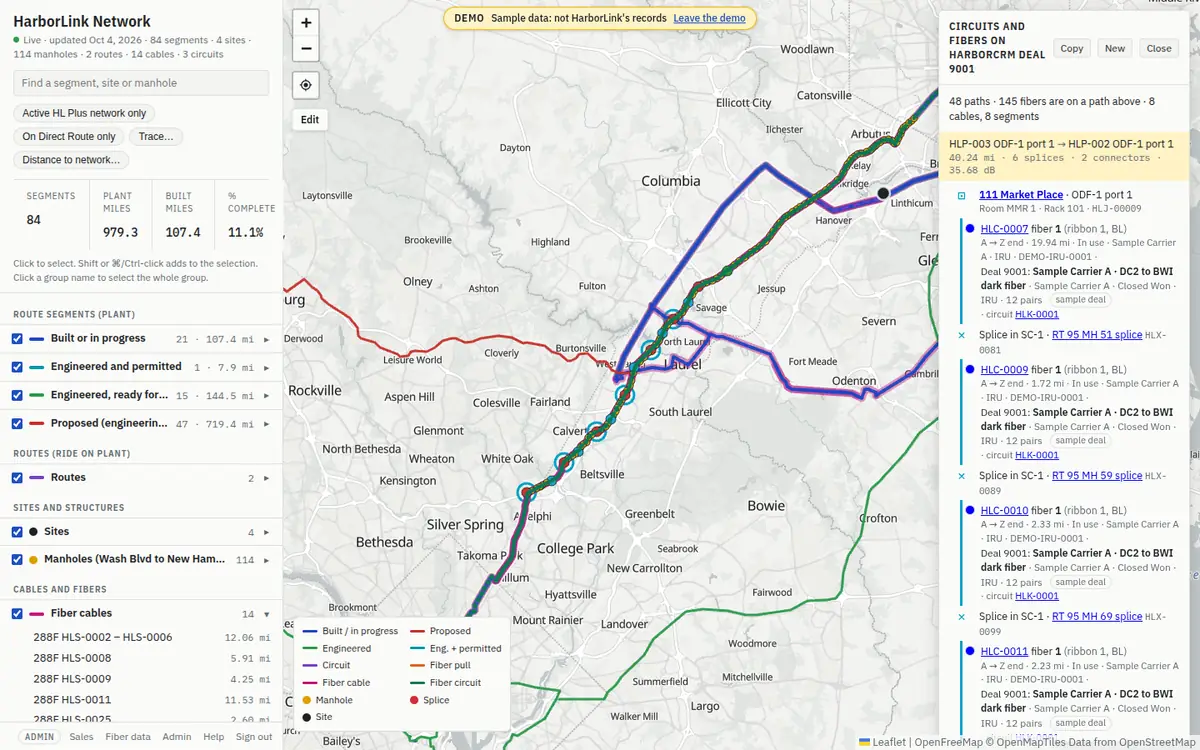
How do I trace a deal?
- Press Trace… under the search box.
- Type the deal number in Or a HarborCRM deal and press Trace.
- The trace lists every fiber and circuit linked to that deal, end to end, and draws them on the map (see Reading a trace).
When HarborCRM is not connected, or down
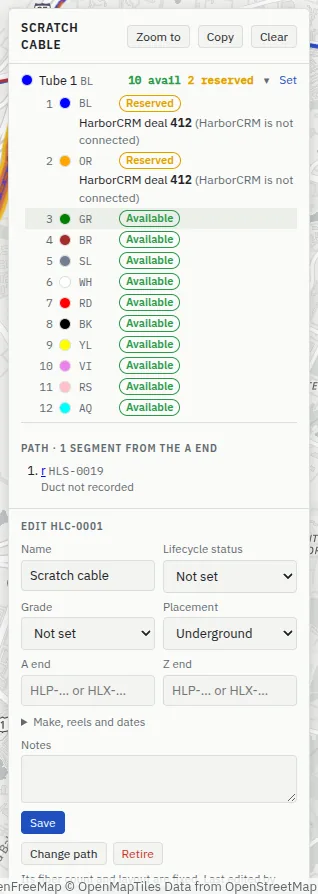
Everything else keeps working. Deals then show just their number, saying why: HarborCRM deal 412 (HarborCRM is not connected) when the app has not been connected to HarborCRM, or (HarborCRM is unreachable) when HarborCRM does not answer. Look up deal says HarborCRM could not be asked, and links are saved unchecked, as above. An admin can see which it is on Admin → System.
9Collecting data by CSV
The Fiber data page (editors and admins; the link is at the bottom of the map's left column) loads ducts, cables, fiber assignments, splices and terminations from spreadsheets. One-off changes are quicker on the map, in edit mode. A CSV file is a spreadsheet saved as plain text, with commas between the columns; Excel, Numbers and Google Sheets can all save one.
There is a tab for each kind of data:
- Ducts: one row per duct. Segments with no ducts yet have a blank row to fill in.
- Cables: one row per cable, with its path (the segments from the A end).
- Fiber assignments: one row per range of fibers with the same status, owner, lessee and contract.
- Splice matrices: one row per range spliced (or express) from one cable to another in a splice case. Each KMZ splice point with no case yet has a blank row.
- Terminations: one row per run of ports with fibers from one cable, e.g. ODF-1 ports 1–24 take HLC-0001 fibers 1–24. Each site with no panel yet has a blank row.
How do I load a spreadsheet?
- Open Fiber data and choose the tab.
- Press Download template. The template already lists what is recorded, so it is also an export.
- Open it in Excel, Numbers or Google Sheets. Fill in or correct rows; rows you leave alone change nothing. Columns, at the bottom of the page, says what each column takes.
- Save it as CSV (up to 2 MB).
- Pick the file with the file box beside Download template, and press Preview. Every row is checked and nothing is written. The result counts what would be added, updated, retired or removed, and lists each changed row.
- If there are no errors, press Apply. The page says Applied file name. Every change is logged with the file's name.
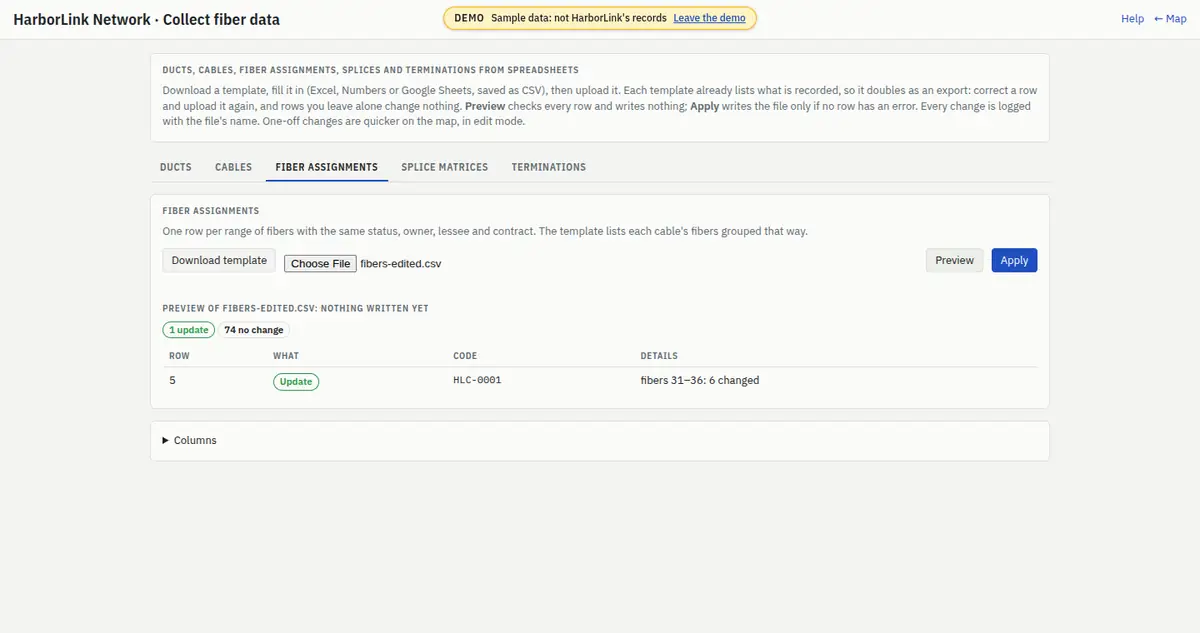
If a row has an error, nothing is written: the rows are listed with their row number and what is wrong, and Apply stays grey. Fix them in the file and preview again.
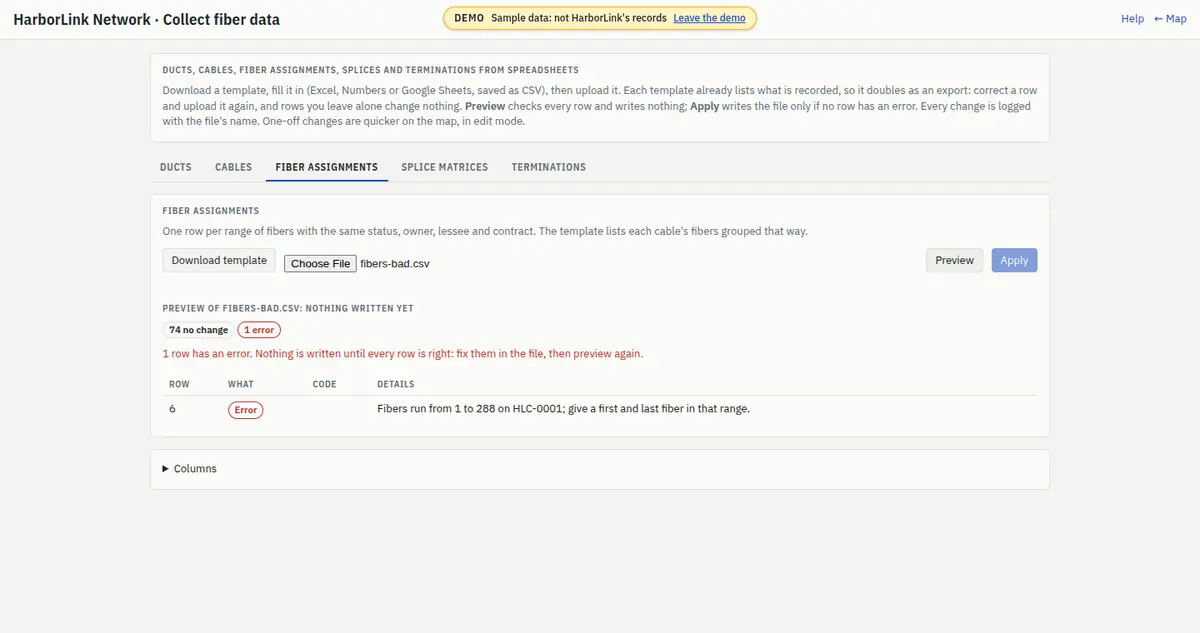
If someone edits the network between your preview and your apply, the apply is refused: preview the file again, then apply.
10Admin
Admins open the Admin page from the bottom of the map's left column. It has six tabs: Users, KMZ imports, Progress, Share links, System and Audit log.
How do I add a user, change a role, or reset a password?
- On Users, under Add a user, type their Email and Name and choose a Role (Viewer, Editor or Admin; see Who does what).
- Press Add user. A temporary password appears, shown once. Press Copy and send it to them privately.
- They sign in with it and choose their own password. Until then their status is Temporary password.
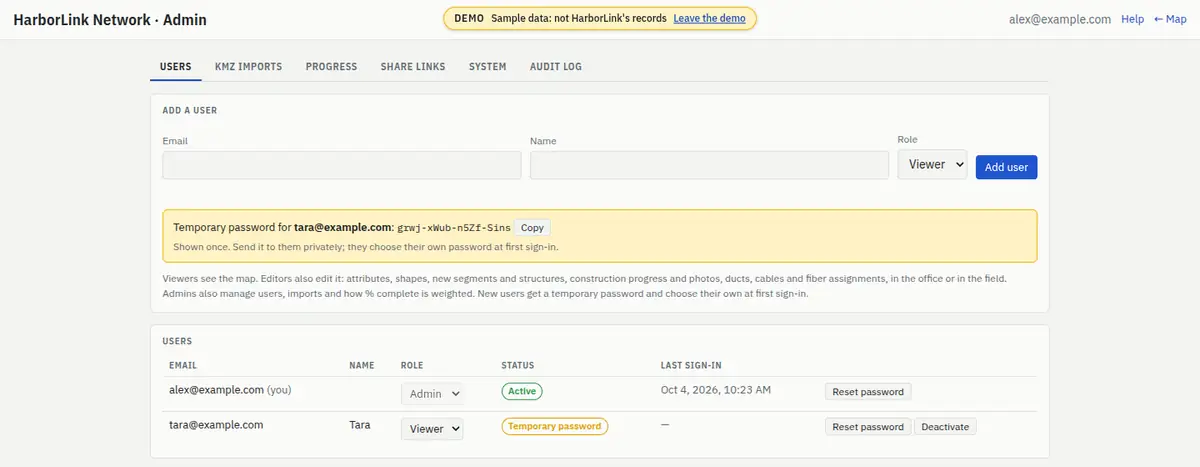
- Change a role: choose it in the user's Role box. It takes effect at once: they are signed out, and see their new role when they sign in again. You cannot change your own role.
- Reset password: signs them out and shows a new temporary password, once.
- Deactivate: signs them out and stops them signing in; Activate lets them back in. There is no delete: deactivate people who leave.
How do I import a new KMZ from Tom?
A KMZ is the Google Earth file Tom keeps the network in. The app was loaded from four of them; when Tom sends a new version, import it:
- On KMZ imports, choose the file or files that changed (for example a new Harbor Link Network KMZ (Sales)). Files you leave out are reused from the last import.
- Press Preview changes. Nothing changes yet. A table shows, for segments, sites, structures and routes, how many would be Added, Updated, Retired, Restored and Unchanged, and the App edits kept; below it, each change field by field.
- If it looks right, press Apply import.
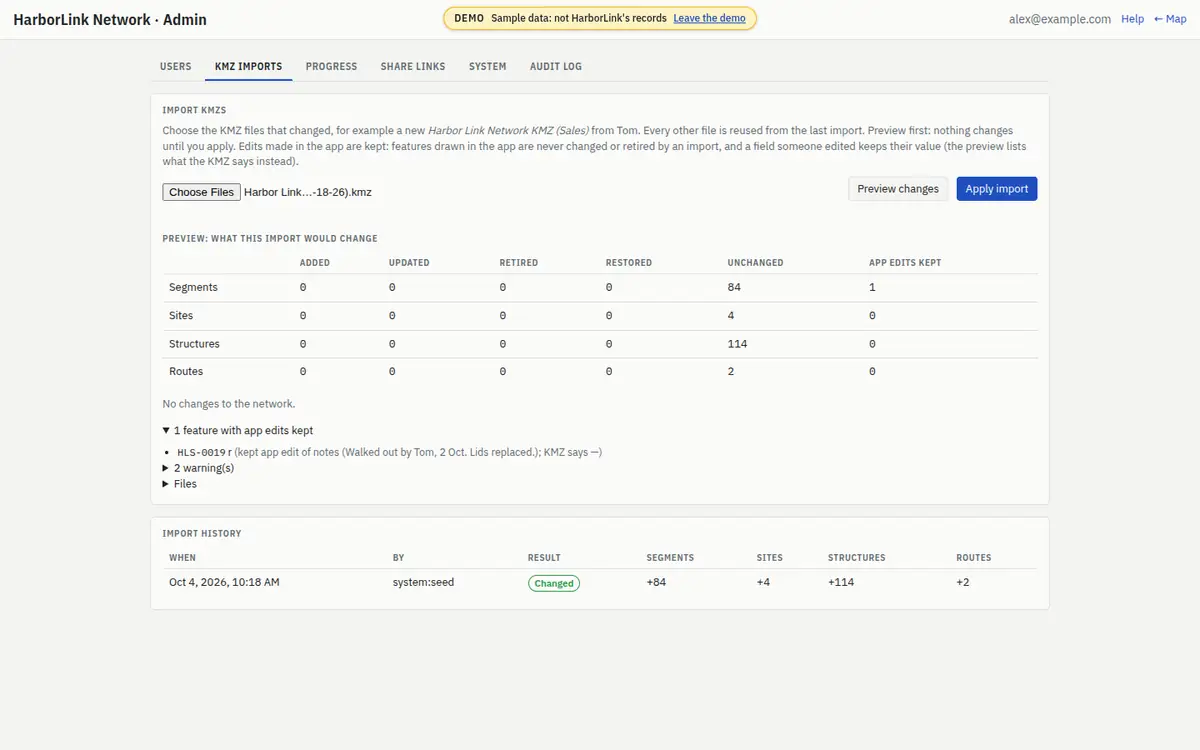
The “app edits kept” rule. Once people edit in the app, the KMZ is no longer the only source of truth:
- Features drawn in the app are never matched, changed or retired by an import.
- A field someone changed in the app keeps the app's value, including a shape, a move or a retirement. The preview lists these under app edits kept, with what the KMZ says instead, for example kept app edit of name (Powder Mill north); KMZ says r.
- Every other field still follows the KMZ.
Import history lists every import; click one to see what it changed.
How do I change how % complete is worked out?
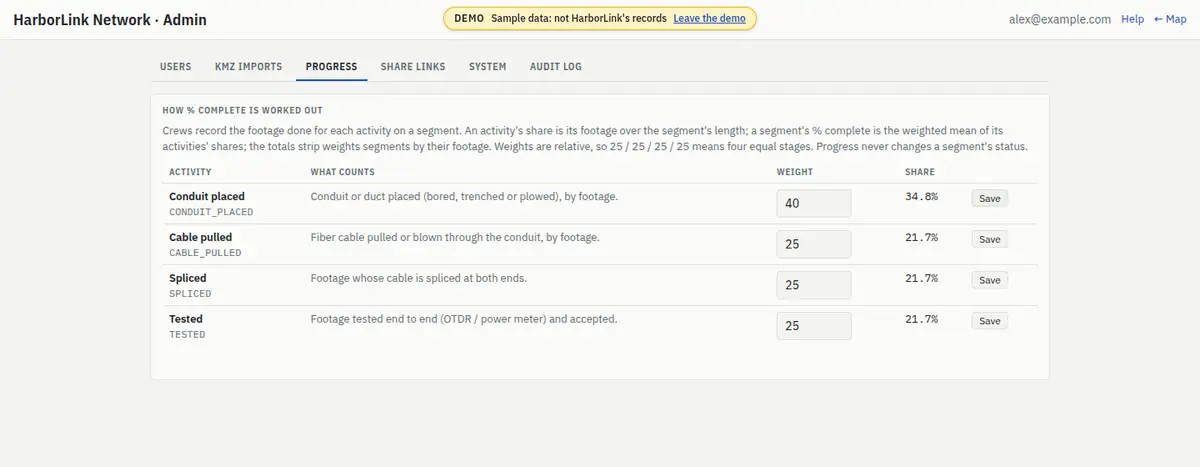
% complete combines the four activities by weight:
- Each activity's share of a segment is its feet done divided by the segment's length, up to 100%.
- A segment's % complete is the weighted average of its four shares. With the starting weights, 25 / 25 / 25 / 25, conduit along the whole segment and cable pulled along half of it gives (100 + 50 + 0 + 0) ÷ 4 = 37.5%.
- The totals strip and multiple selections weight each segment by its length.
To change it: on Progress, type a new Weight beside an activity and press Save on that row. Weights are relative: the Share column shows each one's part of the whole. Every % complete on the map follows at once. Progress never changes a segment's status.
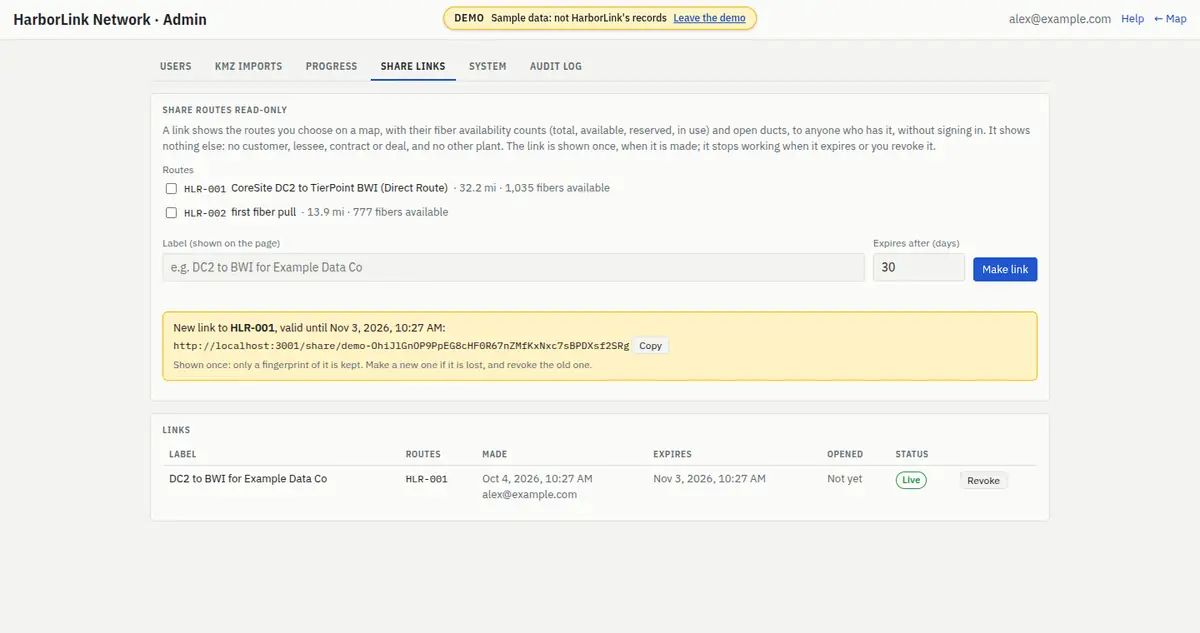
How do I share routes with someone outside HarborLink?
A share link is a web address that shows chosen routes and their fiber counts to anyone who has it, without signing in: for example, for a prospective customer.
- On Admin → Share links, tick the Routes to show.
- Give a Label, shown as the page's title (e.g. DC2 to BWI for Example Data Co).
- Set Expires after (days): 30 to begin with, up to 365.
- Press Make link. The link appears once: press Copy and send it. The app keeps only a fingerprint of it, so it cannot show it again; if it is lost, make a new one and revoke the old one.
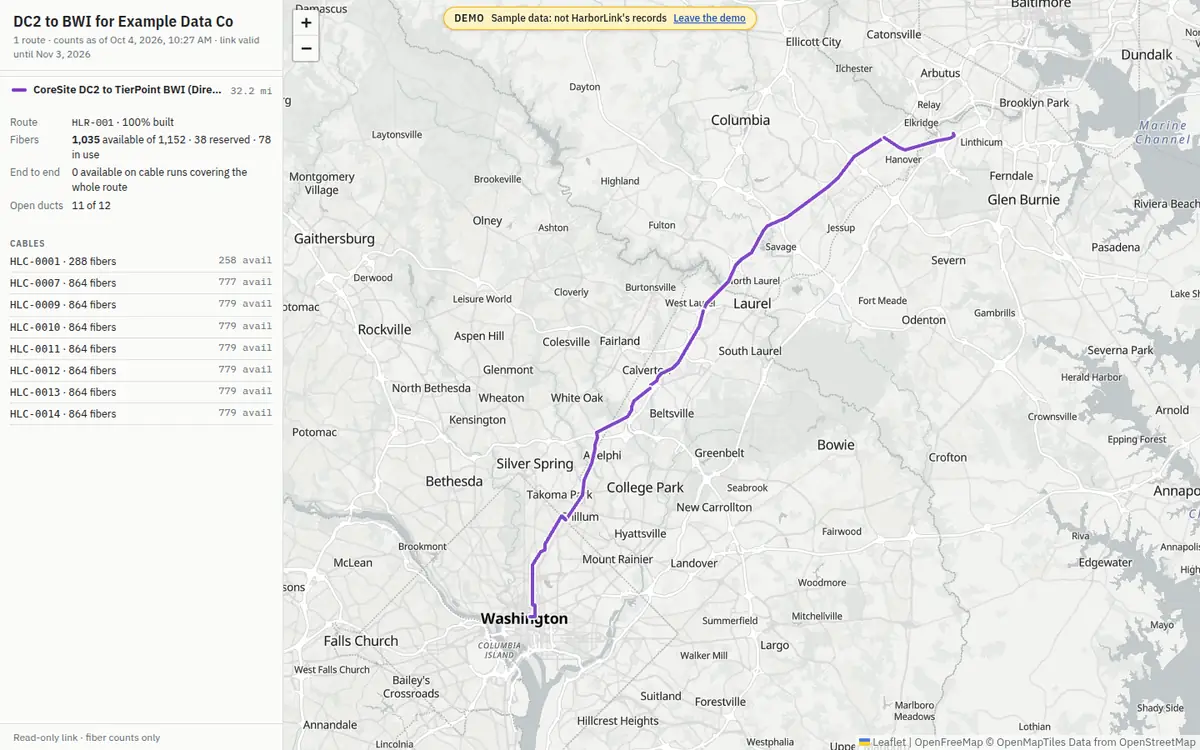
What the link shows: those routes on a map, each with its length, how much is built, its fibers (available, reserved and in use), what is available end to end and its open ducts, and the same counts for each cable by its code. What it does not show: any customer, lessee, contract or deal; the split between IRU, lease and own use; cable names; and any other route or plant.
- The list shows each link's label, routes, who made it and when, when it expires, how often and when it was last opened, and whether it is Live, Expired or Revoked.
- Revoke ends a link at once (after you confirm). Anyone opening it then sees This link is not valid, has expired or has been revoked., as they do after it expires.
System and audit log
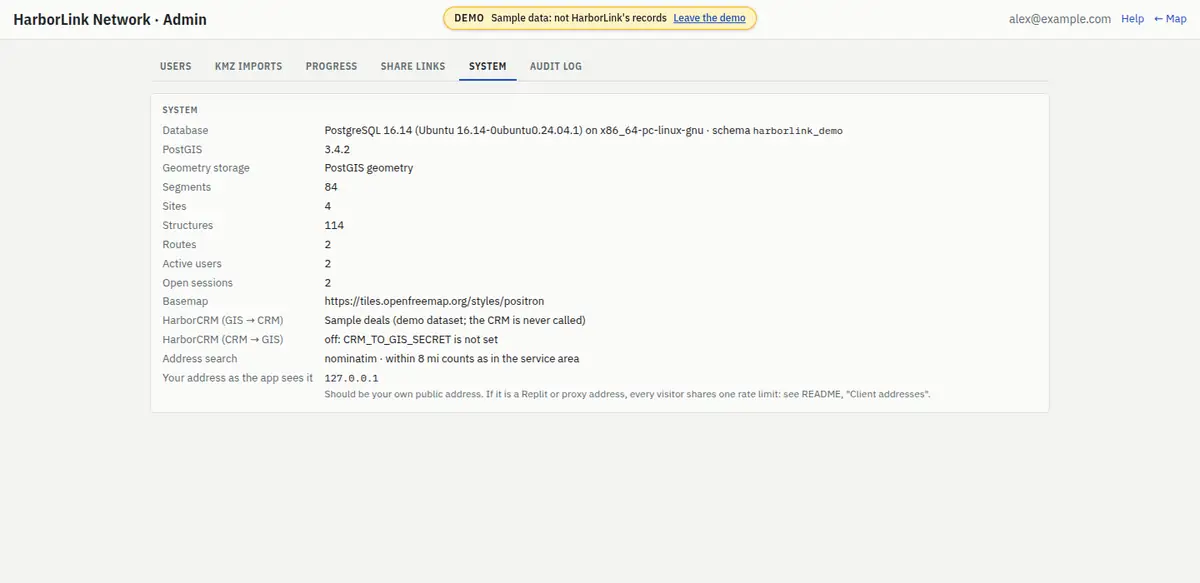
- System shows the database, whether PostGIS (the database's map extension) is available and how map shapes are stored, how many segments, sites, structures and routes there are, active users, open sessions, the basemap in use, and:
- HarborCRM (GIS → CRM): whether the map can read deals from HarborCRM: Connected (with its address), Unreachable (HarborCRM does not answer), Off (not connected, with what setting is missing), or, in the demo, Sample deals.
- HarborCRM (CRM → GIS): whether HarborCRM can read from the map (on, or off and why).
- Address search: the service used for distance to network, and the 8-mile service area.
- Your address as the app sees it: see below.
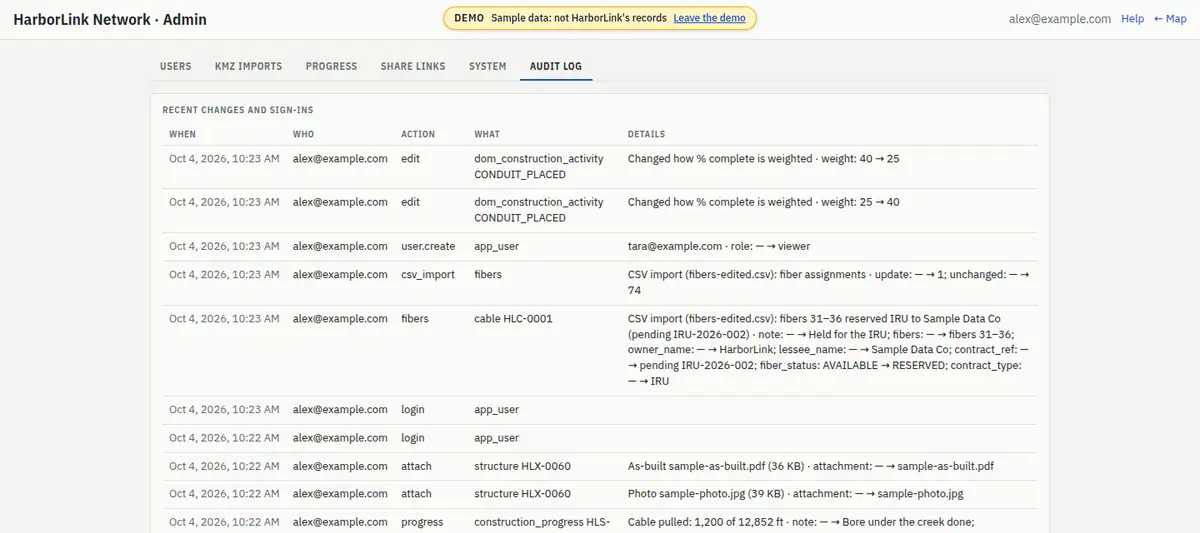
- Audit log lists recent changes and sign-ins: when, who, what they did, to what, and the details (each changed field, old → new). It shows the latest 200; choose Dates above it to see a range of days (up to 2,000 entries). The address keeps the dates, so you can send a filtered log to another admin.
Checking “Your address as the app sees it”
Share links and HarborCRM's requests are limited per visitor's internet address, so the app must see each visitor's own address. After the app is deployed (or moved), check it once:
- Open Admin → System on the published app, from your office or home connection.
- Your address as the app sees it should be your own public internet address (a search for “what is my IP” shows it).
- If it shows an address of Replit's, or a private one (starting
10.,172.16.–172.31.,192.168.or127.), every visitor is sharing one limit: one person trying 20 wrong share links would lock everyone out of share links for 15 minutes. Tell whoever maintains the app (the README's “Client addresses” explains the fix).
Users can also be managed from the command line by whoever runs the app; see the README.
11The demo dataset
HarborLink has not supplied ducts, cables, fiber assignments, splices, progress or photos yet, so the real map has none of them to show. For demonstrations the app keeps a second, separate copy of the network at /demo (the app's address followed by /demo), with made-up data for what is missing.

What is real and what is made up?
- Real: the segments, manholes, sites and routes, with their status and owners, all from the KMZs.
- Made up:
- ducts on the 21 built segments, from the known duct banks;
- 14 cables, among them an 864-fiber backbone from 111 Market Place to CoreSite DC2 laid as 7 reels, spliced at the six KMZ splice manholes;
- fibers leased to made-up customers named Sample … (Sample Carrier A, Sample Cloud B, Sample Enterprise C): IRUs, leases, a reservation pending an IRU, HarborLink's own fibers and a damaged fiber;
- splice cases, patch panels (ODF-1) at three data centers, and three circuits;
- construction progress, and photos and as-built drawings that say SAMPLE on their face;
- six sample HarborCRM deals, numbered 9001–9006 (e.g. 9001 Sample Carrier A · DC2 to BWI dark fiber), with each sample contract's fibers and circuit linked to its deal. 9006, Sample Data Co · Arlington lease, has no fibers yet, for trying Look up deal. The demo never contacts the real HarborCRM.
- Made-up cables carry a sample tag in the panel, and the made-up customers' names start with Sample.
How do I open the demo, and leave it?
- Go to the app's address followed by
/demo. - Sign in with a demo login (see below).
- To go back to the real map, press Leave the demo in the banner, and sign in to the real map if asked.
- Separate logins. The demo has its own users, with their own passwords. Its first admin signs in with the email and password set in the app's
ADMIN_EMAILandADMIN_PASSWORDsettings (Replit Secrets), not with the real map's current password if that has since been changed. Admins can add guest accounts on the demo's own Admin page; those cannot sign in to the real map. - Share links made in the demo work like real ones, and show only demo data.
- Edits stay in the demo. Anything changed in the demo is never written to the real network, so it is a safe place to practise.
- Starting over. Whoever runs the app can reset the demo: run
pnpm run demo resetinartifacts/harborlink-map(on Replit, in the Shell), then restart the app (on Replit, Stop and Run). The reset also removes the demo's guest accounts, and nobody can sign in to the demo until the app has restarted.
12Glossary
| Term | Meaning |
|---|---|
| A end, Z end | The start and end of a cable (or of a fiber's path). The cable's path is listed from its A end. |
| Active HL Plus network | The segments in Tom's Active HL Plus Partner Network KMZ. A filter button and a Yes/No row on segments and sites. |
| As-built | A drawing or document of what was actually built. Added to segments and structures as an image or PDF. |
| Asset state | Esri's status for whether plant is in use: Proposed, In Service, Out of Service, Planned Removal. |
| Asset type | Esri's kind of feature: Conduit, Duct Bank, Trench, Aerial Pathway for segments; Manhole, Handhole, Vault, Pedestal, Cabinet, Pole… for structures. |
| Breakout diagram | A printable page showing where every fiber of a cable, splice case or site goes, and who owns or leases it. |
| Buffer tube | A coloured tube of 12 fibers inside a loose-tube cable. |
| Cable | A fiber-optic cable (code HLC-…), with its fiber count, layout and path through the segments. |
| Circuit | A customer's service between two ports, running through cables and splices (code HLK-…). Not to be confused with a route of type Circuit, which comes from the KMZ. |
| Connector | Where a fiber plugs into a port. A trace counts one connector pair per port. |
| Contract, contract ref | How fibers are held: IRU, Lease or Own use; and the contract's reference, e.g. IRU-2026-001. |
| CSV | A spreadsheet saved as plain text with commas between columns. Used on the Fiber data page. |
| Deal | A sale in HarborCRM, known by its number (the end of the deal page's address). Fibers and circuits can be linked to their deal. |
| dB (decibel) | The unit of light lost along a fiber. See loss budget. |
| Distance to network | How far an address is from built plant, with the website's verdict: within 8 miles or not. |
| Direct Route | The KMZ route from CoreSite DC2 to TierPoint BWI. A filter button and a Yes/No row on segments and sites. |
| Duct, innerduct, microduct, casing | Pipes cables run through. A casing holds microducts; an innerduct sits in a duct. Codes HLD-…. |
| Duct bank | The set of ducts laid together along a segment, e.g. the I-95 bank. |
| Edit mode | Where editors and admins change the network. Turned on with the Edit button. |
| End to end | On the Sales page: the available fibers that run all the way along a route, joined through cables and splices that together cover every one of its segments. |
| Esri | The company behind ArcGIS. The app stores the network in Esri's standard model for fiber networks (the Communications Utility Network Foundation), so it can be loaded into ArcGIS; that is where words like asset state, lifecycle and asset type come from. |
| Express | A fiber that passes through a splice case uncut. |
| Far end | In a breakout diagram, where a fiber's path ends, through every splice, port and patch cord. |
| Fiber | One glass strand in a cable, numbered from 1, with a TIA-598 colour, a status and, if leased, a lessee and contract. |
| Field mode | The map on a phone or tablet: My location, adding at your location, photos and progress. |
| Group | A set of items in the layer register, e.g. Built or in progress. Click its name to select it all. |
| HarborCRM | HarborLink's sales system, where deals are kept. |
| IRU | Indefeasible right of use: a long-term right to use fibers, usually paid up front. |
| KMZ | A Google Earth file. Tom's KMZs are the source of the segments, manholes, sites and routes. |
| KMZ colour | The colour a segment has in Tom's KMZ, with his legend's wording, kept on each segment. |
| Layer register | The list of everything on the map, in the left column. |
| Lease, lessee | Fibers rented for a term, and who rents them. |
| Lifecycle status | Where a feature is in its life: Design, Approved, Under Construction, Construction Complete, Maintenance… and HarborLink's Proposed (engineering study complete). Sets the segment's colour. |
| Loss budget | The light a path is expected to lose, worked out from standard maximums. A planning figure, not a measurement. |
| Manhole, structure | An underground access point (code HLX-…). Handholes, vaults, cabinets and poles are structures too. |
| Open ducts | On the Sales page: the fewest open ducts on any segment of a route or cable, out of those there. |
| Own use | Fibers HarborLink uses itself. |
| Patch cord | A short jumper between the fronts of two ports at a site. |
| Patch panel, ODF, port | The panel at a site where fibers end, each on a numbered port. Panel codes are HLJ-…; a port is written panel code:port, e.g. HLJ-00009:5. |
| % complete | Construction progress: the weighted share of each activity's footage done. |
| Reel set-up | Where a cable reel was set up to pull cable, as marked in the KMZ. |
| Retire | Remove from the map while keeping the record. Codes are never reused. |
| Ribbon | 12 fibers bonded side by side. Ribbons are numbered, not coloured. |
| Route | A path from the KMZ that rides on the segments, e.g. the Direct Route (code HLR-…). |
| Segment (route segment) | A stretch of HarborLink's plant (code HLS-…). |
| Selection panel | The box on the map that shows what you selected. |
| Share link | A web address an admin makes that shows chosen routes and their fiber counts to anyone, without signing in, until it expires or is revoked. |
| Site | A building on the network, such as a data center (code HLP-…). |
| Slack loop | Spare cable coiled in a manhole. |
| Splice, splice case, splice point | A join between two fibers; the enclosure where splices are made (code HLJ-…); and a manhole the KMZ marks for splicing. |
| Termination | A fiber put on a port. |
| TIA-598 | The industry standard for fiber and tube colours: blue, orange, green, brown, slate, white, red, black, yellow, violet, rose, aqua. |
| Trace | Following fibers end to end through splices and ports, with the path drawn on the map. |
| Tracer | A stripe on a fiber or tube, used after the first twelve colours. |
| TSV | Text with tabs between columns; what Copy puts on the clipboard for pasting into a spreadsheet. |
13FAQ and troubleshooting
I don't see the Edit button, or the Fiber data or Admin links.
Your role does not include them: Edit and Fiber data are for editors and admins, Admin for admins. Ask an admin to change your role.
The page sent me back to the sign-in page.
You were signed out: you had not used the app for a while, or an admin changed your role or reset your password. Sign in again (with the new temporary password, after a reset); you come back to the page you were on.
If an admin deactivated your account, signing in will not work: it says Email or password is incorrect. Ask an admin to activate your account again.
Signing in from Replit's preview does nothing.
Some browsers block sign-in inside Replit's workspace preview. Open the preview in a new tab.
The map says Could not load the network.
The server could not be reached. Check your connection and press Retry.
The map has no background streets.
The street map comes from an outside service (OpenFreeMap). If it is unreachable, or your device cannot draw it, the network still shows on a plain background.
On a Google map, a red banner saying Google refused the site's key means the map cannot show until an admin fixes the key in Google Cloud; tell whoever runs the app. If a For development purposes only watermark shows, the app has no Google key set.
I can't click a cable on the map.
Cables are drawn under the segments. Pick the cable in the Fiber cables group, search for its HLC- code, or untick the segment groups and click the pink band.
A segment shows 100% complete but is still Under Construction.
Progress never changes status, on purpose. An editor changes the segment's lifecycle status when the work is accepted.
Why are red segments called “Proposed”?
See Status colours: no right-of-way agreement is on file for them yet.
My location does not show.
Allow location for this site in your browser or phone settings. Inside Replit's preview pane browsers don't share your location at all: open the map in its own browser tab. Indoors or under cover the fix can be slow or poor; the accuracy figure tells you how good it is.
My save was refused.
Read the message under the button. Changed by someone else: see above. No connection: press Retry when you have signal. A message about something in use (for example a cable through a segment you want to retire) says what to clear first.
A trace says Not joined.
The path stops there because nothing is recorded beyond it: no splice at that manhole, no fiber on a port, or the cable's end is not recorded. Record the missing splice, termination or cable end.
A trace lists many paths and the one I want is far down.
Tracing a customer or a contract lists every one of their fibers. Paths that end on ports at both ends read site panel port → site panel port; the others start or end with not joined. Trace a single port or circuit for one path.
Apply is grey on the Fiber data page.
Either a row has an error (fix it and preview again), or the file changes nothing.
How do I bring back something I retired?
Not in the app yet. Ask whoever runs the app to restore it in the database. A later KMZ does not bring it back: imports keep what was retired in the app.
How do I change my password?
Ask an admin to reset it. You then sign in with the temporary password and choose your own.
How do I switch to dark mode?
Switch your device to dark mode; the app follows it.
How do I print this guide?
Press Print or save as PDF at the top of this page (or use your browser's Print), and choose Save as PDF to keep a copy. It prints in light colours, with the contents first and each chapter on a new page.
Distance to network says Address not found or Address search failed.
Not found: add the town or ZIP code, or check the spelling. Failed: the address service did not answer; try again in a minute. If it says you have looked up 30 addresses, wait the minutes it gives.
Why does a route show 0 end to end when it has fibers available?
Its cables are not recorded as spliced together all the way along it. See the Sales page; record the splices to fix it.
How do I find a contract's deal in HarborCRM?
Open the fibers or circuit on the map: the Deal label links to the deal in HarborCRM (↗). If there is no label, an editor can link the deal.
A deal shows only its number, with HarborCRM is not connected or unreachable.
The map cannot reach HarborCRM right now; see When HarborCRM is not connected, or down. An admin can check Admin → System.
Someone says a share link does not work.
It has expired or been revoked, or the address was copied incompletely. Make a new one on Admin → Share links.
The open-source software the app uses, and its licences: third-party notices.